Introduction
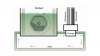
 Fig. 1: Schematic representation of the sequence of deposited layers on the steel plates Alle Fotos und Grafiken: TU IlmenauNickel is usually used as a bright coating underneath a much thinner chromium film to provide a highly bright, decorative appearance and corrosion resistance on different substrates such as steel, brass, copper, and metallized plastics. The physical properties of nickel/chromium coatings mostly depend on the thickness and quality of the nickel layer [1]. Dobrev (1986) [2] and General Motors (2010) demonstrated a significant improvement in the corrosion resistance of substrates in the automotive and sanitation industry by introducing subsequent nickel layers as a duplex nickel system. This method involves two layers of nickel under a chromium layer. The first is a semi-bright nickel layer directly electroplated onto the substrate and the second is a bright nickel layer. The semi-bright nickel layer is produced by sulfur-free additives, whereas the subsequent bright nickel layer contains sulfur due to the brighteners. Usually, these nickel layers are electroplated prior to the chromium plating for exterior automotive applications. Generally, two types of chromium processes are recommended to increase the corrosion resistance of conventional chromium deposits: micro-cracked and microporous chromium. A thin layer of nickel over the bright nickel is known as microporous or micro-cracked nickel. In this case, the corrosion current can spread over numerous tiny corrosion cells. These micro-sized pores help spreading the corrosion current into many small pores rather than a few large sites of conventional chromium deposits, delaying the corrosion process [3]. The use of highly porous bright chromium on these double-layered nickel deposits gives outstanding outdoor corrosion protection [4]. Deposition of chromium from hexavalent electrolytes shows a higher corrosion resistance than trivalent chromium. Different types of post-treatment have been suggested to increase the corrosion resistance of the chromium layer from trivalent baths. However, the corrosion properties of nickel/chromium coatings are also influenced by various parameters such as the numbers, types, and thickness of deposited layers [5]. This study’s motivation was to improve the corrosion resistance of the chromium coatings made from trivalent baths. For this purpose, the effect of anodic post-treatment on the corrosion resistance of the micro-cracked and the conventional chromium (III) on the double layer nickel coatings was investigated. Furthermore, the effect of the thickness of bright and semi-bright nickel layers on the corrosion behavior was studied.
Experimental
 Fig. 2: STEP test results for SB-Ni10-Br-Ni5-HS-Ni1.5-Cr0.15, Thicknesses of Semi Bright Ni layer 4.5 μm, Bright Ni 8.4 μm. highly stressed nickel layer 1.0 μm. Dissolution potentials for bright nickel 0.73 V and for semi-bright nickel 0.91 VAll electrodeposition experiments in this study were carried out on ST37 steel plates (12 ×5 cm2). All the electrolytes were provided by Dr.-Ing. Max Schlötter GmbH & Co. KG. The plates were first degreased with an alkaline cleaner (SLOTOCLEAN 160 (30 g/L)) at 65 °C for 10 min and then anodically degreased (SLOTOCLEAN EL DGC (120 g/L)) at 25 °C for 5 min, j = 8 A/dm2, pickled in 5% HCl solution at 25 °C for 30 sec. After the pretreatment, 10 or 5 µm of semi-bright Watts nickel (SLOTONIK HG 1630) at 60 °C, pH = 4.2, j = 4 A/dm2 and then 10 or 5 µm of bright nickel (SLOTONIK 20) at 60 °C, pH = 4.2, j = 4 A/dm2 were electrodeposited. Some specimens were later electrodeposited with 1–2 µm highly stressed nickel layer from a chloride-based electrolyte (VP 04 1520) at 25 °C for 2 min, pH = 3.9, j = 8 A/dm2, followed by about 0.2 µm of chromium from trivalent chromium electrolyte (SLOTOCHROM DR 1140) at 50 °C for 6 min, pH = 3.7, j = 5 A/dm2. After chromium deposition, some specimens were anodically treated by SLOTOCHROM DR 2430 electrolyte containing phosphorus and chromium (III) with/without cobalt at 25 °C for 2 min, pH = 3.5, j = 0.1 A/dm2. The composition of the electrolyte is listed in Table 1. The sequence of deposited layers on the steel plates is depicted in Figure 1 and Table 2 shows the various coating systems.
|
Additive VP 05 2431 (Trivalent Chromium salt, Complex Agent) |
120 ml/L |
|
Additive VP 05 2432 (Antioxidant) |
25 ml/L |
|
Additive VP 05 2433/34 (Source of Phosphorous / Cobalt) |
14 g/L |
|
Samples |
|
|
1- Semi Bright Ni (10 μm) / Bright Ni (5 μm) / |
SB-Ni10-Br-Ni5-Cr0.15 |
|
2- Semi Bright Ni (5 μm) / Bright Ni (10 μm) / |
SB-Ni5-Br-Ni10-Cr0.15 |
|
3- Semi Bright Ni (5 μm) / Bright Ni (10 μm) / |
SB-Ni5-Br-Ni10-HS-Ni1.5-Cr0.15 |
|
4- Semi Bright Ni (10 μm) / Bright Ni (5 μm) / |
SB-Ni10-Br-Ni5-HS-Ni1.5-Cr0.15 |
|
5- Semi Bright Ni (5 μm) / Bright Ni (10 μm) / |
SB-Ni5-Br-Ni10-Cr0.15-APT |
|
6- Semi Bright Ni (10 μm) / Bright Ni (5 μm) / |
SB-Ni10-Br-Ni5-Cr0.15-APT |
|
7- Semi Bright Ni (5 μm) / Bright Ni (10 μm) / |
SB-Ni5-Br-Ni10-HS-Ni1.5-Cr0.15-APT |
|
8- Semi Bright Ni (10 μm) / Bright Ni (5 μm) / |
SB-Ni10-Br-Ni5-HS-Ni1.5-Cr0.15-APT |
|
9- Semi Bright Ni (5 μm) / Bright Ni (10 μm) / |
SB-Ni5-Br-Ni10-Cr0.15-APT-Co |
|
10- Semi Bright Ni (10 μm) / Bright Ni (5 μm) / |
SB-Ni10-Br-Ni5-Cr0.15-APT-Co |
|
11- Semi Bright Ni (5 μm) / Bright Ni (10 μm) / |
SB-Ni5-Br-Ni10-HS-Ni1.5-Cr0.15-APT-Co |
|
12- Semi Bright Ni (10 μm) / Bright Ni (5 μm) / |
SB-Ni10-Br-Ni5-HS-Ni1.5-Cr0.15-APT-Co |
Results and discussion STEP test (Simultaneous Thickness and Electrochemical Potential)
This study used the STEP method to measure the potential difference and the thickness of layers between bright, semi-bright, and micro-cracked nickel. Figure 2 confirmed the expected nickel coating thicknesses (nearly 10, 5, and 2 μm), the potential difference between bright and semi-bright nickel layers (around 150 mV), and the potential difference between bright and bright highly stressed nickel (around 11 mV) [3]. Because the bright nickel layer’s dissolution potential vs. Ag/AgCl reference electrode is about 0.76 V, which is more negative than the semi-bright nickel layer’s dissolution potential, these potential differences are ideal for increasing the specimens’ corrosion resistance (0.91 V). It indicates that the corrosion starts in the bright nickel layer to protect and delay corrosion in the semi-bright nickel layer.
Neutral Salt Spray (NSS)
The corrosion resistance of the samples 1 to 12 (Table 2) was evaluated using the corrosion tests according to DIN EN ISO 9227. From each sample three plates were tested continuously for 400 hours with a corrosion rating every 24 hours (Tab. 3). Table 4 shows the NSS testing-results of the various samples with and without micro-cracked chromium layer, with and without anodic post-treatment. The NSS tests were stopped when red rust covered the surface.
|
pH (collected solution) |
6.8 |
|
Temperature |
36 °C |
|
Average collection rate for a horizontal collecting area of 80 cm2 |
1.45 ml/h |
|
NaCl Concentration |
54 g/L |
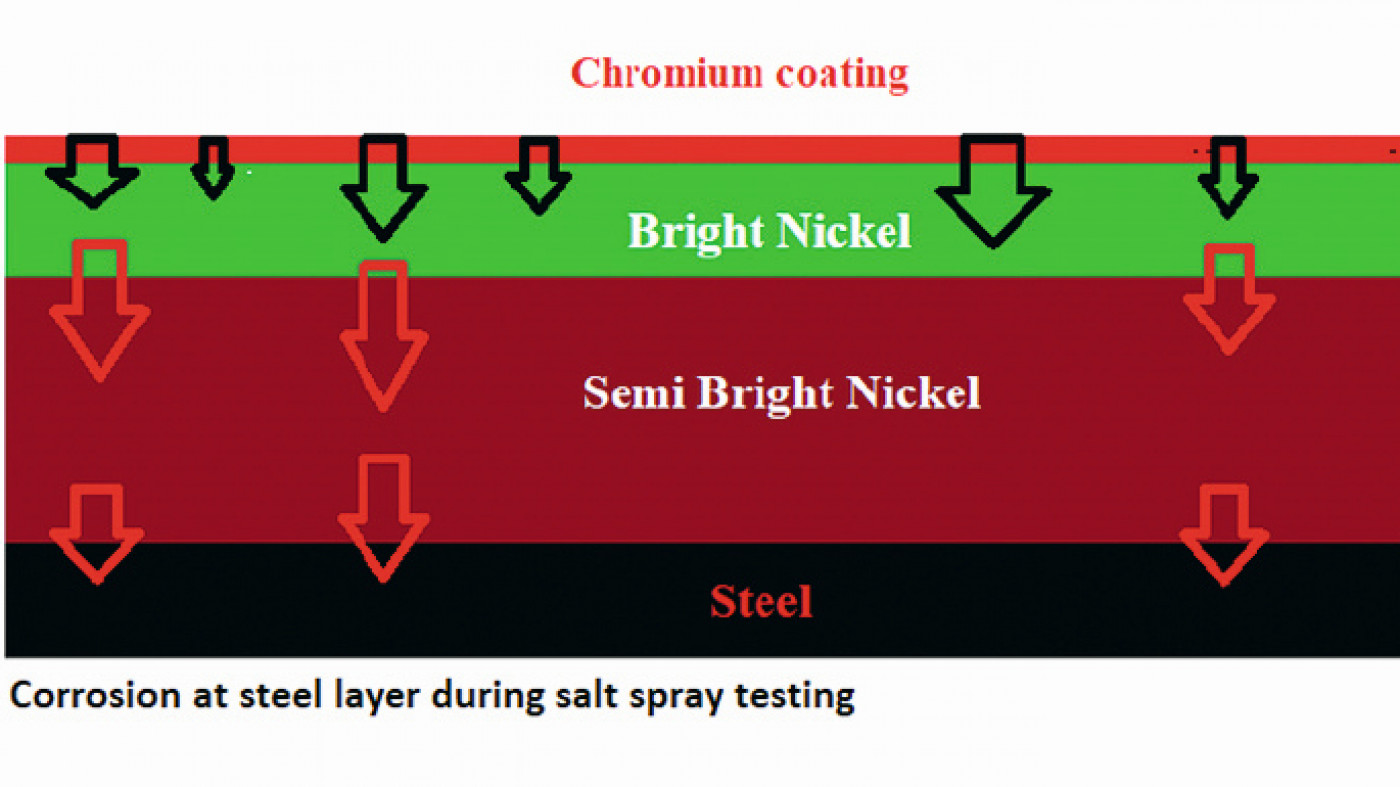
 Fig. 3: Schematic representation of corrosion behavior of the steel plate after salt spray testing
It’s important to remember that the outcome of this test represents the time for the complete layer systems to corrode (Fig. 3). As a result, evaluating the corrosion resistance of each layer separately is impossible.
|
Samples |
Red rust after (hours) |
Corroded plates / Total number of plates, Average corroded points per plate |
|
1- SB-Ni10-Br-Ni5-Cr0.15 |
48 |
3/3, 3 |
|
2- SB-Ni5-Br-Ni10-Cr0.15 |
72 |
2/3, 4 |
|
3- SB-Ni5-Br-Ni10-HS-Ni1.5-Cr0.15 |
96 |
3/3, 3 |
|
4- SB-Ni10-Br-Ni5-HS-Ni1.5-Cr0.15 |
408 |
2/3, 1 |
|
5- SB-Ni5-Br-Ni10-Cr0.15-APT |
192 |
3/3, 3 |
|
6- SB-Ni10-Br-Ni5-Cr0.15-APT |
168 |
3/3. 3 |
|
7- SB-Ni5-Br-Ni10-HS-Ni1.5-Cr0.15-APT |
120 |
2/3, 2 |
|
8- SB-Ni10-Br-Ni5-HS-Ni1.5-Cr0.15-APT |
456 |
2/3, 1 |
|
9- SB-Ni5-Br-Ni10-Cr0.15-APT-Co |
120 |
3/3, 2 |
|
10- SB-Ni10-Br-Ni5-Cr0.15-APT-Co |
264 |
2/3, 3 |
|
11- SB-Ni5-Br-Ni10-HS-Ni1.5-Cr0.15-APT-Co |
216 |
2/3, 1 |
|
12- SB-Ni10-Br-Ni5-HS-Ni1.5-Cr0.15-APT-Co |
312 |
2/3, 1 |
As expected the conventional chromium systems (samples 1, 2 from Tab. 4) have lower corrosion resistance than the other coating systems. The corrosion resistance of sample 2, on the other hand, is higher than sample 1. The thick bright nickel layer has a higher tendency to corrosion than the semi-bright nickel layer due to the potential difference between the two layers (Chapter STEP Test). As a result, the thicker bright nickel layer is more corroded, delaying the substrate’s corrosion process in conventional chromium coating. Micro-cracked chromium has excellent corrosion resistance. When comparing the corrosion resistance of the samples with and without micro-cracks, as well as with and without anodic post-treatment, it is clear that the micro-cracked samples 4, 8, and 12 (Tab. 4) have the highest corrosion resistance, which could be slightly improved by anodic post-treatment. The results also show that anodically treated conventional chromium coatings (samples 5, 6, 9, 10) have better corrosion resistance than conventional chromium coatings, particularly in cobaltbased electrolytes, which could be due to the presence of cobalt in the oxide layer. This clearly demonstrates that anodic post-treatment of deposits can reduce the corrosion rates and provide additional protection to duplex nickel/chrome deposits.
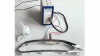
 Fig. 4: Corrosion cell used for linear polarization and impedance spectroscopy
Linear Polarization tests
All samples were analyzed by linear polarization tests at least three times to compare their corrosion resistance. Potentiostats Model Autolab PGSTAT204 from Metrohm and Model SP-300 from Biologic were used. Linear polarization was carried out in 5 % sodium chloride solution (pH = 6.8) at 35 °C using an Ag/AgCl (3M KCl) reference electrode and platinum mesh as an counter electrode (Fig. 4) over a potential range of ± 0.1 V versus open circuit potential with the scan rate of 1 mV/s. Table 5 lists the corrosion current density (jcorr) and corrosion potential (Ecorr) calculated from the intercept of the anodic and cathodic slopes of Tafel plots (Fig. 5).
|
Samples |
Rp(Ω) |
jcorr (A/cm2) |
Ecorr (V) |
Corrosion rate (µm per year) |
|
1- SB-Ni10-Br-N5-Cr0.15 |
1213 |
2.5x10⁻⁷ |
-0.36 |
4 |
|
2- SB-Ni5-Br-Ni10-Cr0.15 |
2131 |
1.4x10⁻⁷ |
-0.39 |
3 |
|
3- SB-Ni5-Br-Ni10-HS-Ni1.5-Cr0.15 |
513 |
3.8x10⁻⁷ |
-0.40 |
9 |
|
4- SB-Ni10-Br-Ni5-HS-Ni1.5-Cr0.15 |
195 |
1.5x10⁻⁶ |
-0.44 |
33 |
|
5- SB-Ni5-Br-Ni10-Cr0.15-APT |
12018 |
2.5x10⁻⁸ |
-0.32 |
< 1 |
|
6- SB-Ni10-Br-Ni5-Cr0.15-APT |
4034 |
7.5x10⁻⁸ |
-0.34 |
1 |
|
7- SB-Ni5-Br-Ni10-HS-Ni1.5-Cr0.15-APT |
1453 |
2.0x10⁻⁷ |
-0.21 |
4 |
|
8- SB-Ni10-Br-Ni5-HS-Ni1.5-Cr0.15-APT |
474 |
6.4x10⁻⁷ |
-0.56 |
10 |
|
9- SB-Ni5-Br-Ni10-Cr0.15-APT-Co |
16204 |
1.8x10⁻⁸ |
-0.19 |
< 1 |
|
10- SB-Ni10-Br-Ni5-Cr0.15-APT-Co |
4484 |
7.2x10⁻⁸ |
-0.29 |
1 |
|
11- SB-Ni5-Br-Ni10-HS-Ni1.5-Cr0.15-APT-Co |
1310 |
2.3x10⁻⁷ |
-0.21 |
4 |
|
12- SB-Ni10-Br-Ni5-HS-Ni1.5-Cr0.15-APT-Co |
570 |
4.2x10⁻⁷ |
-0.47 |
10 |
 coatings system. Smaller corrosion current density for the anodic treated chromium (III) coatings (red, black, purple, and dark blue curves). Higher corrosion current density for conventional chromium coating (purple and dark purple curves). The highest corrosion current density for micro-cracked chromium (III) coating (pink, green, orange, yellow and mustard yellow)") Fig. 5: Polarization curves of the chromium (III) coatings system. Smaller corrosion current density for the anodic treated chromium (III) coatings (red, black, purple, and dark blue curves). Higher corrosion current density for conventional chromium coating (purple and dark purple curves). The highest corrosion current density for micro-cracked chromium (III) coating (pink, green, orange, yellow and mustard yellow) The results show that the anodically treated chromium deposits without micro-cracks have a very low corrosion current and thus a very low corrosion rate. The smallest corrosion current and highest corrosion resistance for sample 9 (SB-Ni5-Br-Ni10-Cr0.15-APT-Co) are found in the anodically treated samples in cobalt-containing electrolytes. This clearly demonstrates how anodic post-treatment of deposits can reduce corrosion rates and provide additional protection to duplex nickel/chrome deposits (without micro-cracks). The salt spray testing results (Section 3.2) also showed that these samples’ corrosion resistance improved significantly after anodic post-treatment. However, the results from NSS and LSV are not exactly comparable.
Fig. 5: Polarization curves of the chromium (III) coatings system. Smaller corrosion current density for the anodic treated chromium (III) coatings (red, black, purple, and dark blue curves). Higher corrosion current density for conventional chromium coating (purple and dark purple curves). The highest corrosion current density for micro-cracked chromium (III) coating (pink, green, orange, yellow and mustard yellow) The results show that the anodically treated chromium deposits without micro-cracks have a very low corrosion current and thus a very low corrosion rate. The smallest corrosion current and highest corrosion resistance for sample 9 (SB-Ni5-Br-Ni10-Cr0.15-APT-Co) are found in the anodically treated samples in cobalt-containing electrolytes. This clearly demonstrates how anodic post-treatment of deposits can reduce corrosion rates and provide additional protection to duplex nickel/chrome deposits (without micro-cracks). The salt spray testing results (Section 3.2) also showed that these samples’ corrosion resistance improved significantly after anodic post-treatment. However, the results from NSS and LSV are not exactly comparable.
According to the polarization measurements, the corrosion resistances of specimens with a similar chromium deposition process (conventional or micro-cracked chromium) and a thicker bright nickel layer are higher than for a thicker semi-bright nickel layer. For example, sample 2 (SB-Ni5-Br-Ni10-Cr0.15) with the thicker bright nickel layer (10 μm) has a higher corrosion resistance than sample 1 (SB-Ni10-Br-Ni5-Cr0.15) with the thinner bright nickel layer (5 μm). Because of the potential difference between semi-bright and bright nickel layers, the bright nickel layer with a higher thickness has a higher corrosion tendency than the semi-bright nickel layer. As a result, stronger corrosion occurs in the thicker bright nickel layer, delaying the overall corrosion process. The measured corrosion current during polarization is related to the bright nickel layer at this time (Fig. 6).
The micro-cracked chromium samples show the lowest corrosion resistance in the polarization measurements, which seems to contradict the salt spray testing results. They could, however, be slightly improved by anodic post-treatment. The corrosion current in polarization test is not related to the thick bright nickel layer at this time, which could explain this behavior. The STEP test revealed that the corrosion potential of bright nickel and highly stressed nickel are close to each other (Section 3.1). Therefore, smaller corrosion currents are thought to be distributed to the thin, highly stressed nickel layer due to many micro-cracks on the chromium surface, which is too small to penetrate to the sublayers during polarization measurements (Fig. 7). As a result, the corrosion current will be mainly located in the thin, highly stressed nickel layer.
Impedance Spectroscopy
To determine and estimate corrosion parameters of the samples by impedance spectroscopy, a Potensiostat Model SP-300 from Biologic, was used. The electrochemical impedance spectroscopy was carried out in 5 % sodium chloride solution (pH = 6.8) at 35 °C to determine the coating’s corrosion behavior in lower and higher frequencies (voltage amplitude of 10 mV at 1 MHz to 100 mHz and 3 MHz to 45 mHz with 10 points per decade). All these systems show a very small single semi-circle in the Nyquist Plot (Fig. 8) associated with double layer capacity and charge transfer resistance, followed by a straight line which is characterized for diffusion mechanism. The equivalent electrical circuit (Fig. 9) was suggested by considering elements such as a capacitors and a resistors related to an oxide layer and a Warburg impedance element related to diffusion which is seen in the Nyquist plot (Fig. 10) with 45-degree line for the anodically treated sample (SB-Ni5-Br-Ni10-Cr0.15-APT) [6].
 Fig. 6: Schematic presentation of corrosion mechanism of the bright nickel layer during polarization measurement for the conventional chromium coatings
Linear polarization results revealed a higher corrosion resistance for the anodically treated samples without micro-cracked chromium and a very low corrosion resistance for micro-cracked chromium samples (Section 3.3). However, the impedance measurements show that the highest value of the charge transfer resistance is related to the untreated micro-cracked chromium samples. This is in accordance with expectations and there is no considerable difference for the other samples (Tab. 6). The highest value of impedances on the Nyquist plot (Fig. 10) and Bode plot (Fig. 11) are related to the anodically-treated specimens without micro-cracked chromium, probably due to the thicker or different oxide layer, confirming the results from the linear polarization tests and then for the untreated micro-cracked chromium layer due to the ability of the corrosion current distribution. The test results for the anodically treated micro-cracked chromium specimens, on the other hand, show a lower impedance, which could be due to the covered micro-cracks on the chromium surface with a thicker oxide layer that reduces the corrosion current distribution.
 Fig. 7: Schematic presentation of corrosion behavior of highly stressed nickel layer during polarization measurement
|
Samples |
Rel / Ω |
Rox/ Ω |
Rct/ Ω |
Capacity of oxide layer / (F.s(a - 1)) |
DL capacity / |
|
1- SB-Ni10-Br-Ni5-Cr0.15 |
2.8 |
1.1e6 |
110 |
2.3e-6 |
2.8e-9 |
|
4- SB-Ni10-Br-Ni5-HS-Ni1.5-Cr0.15 |
5.2 |
3.8e6 |
136* |
2.1e-6 |
2.6e-9 |
|
5- SB-Ni5-Br-Ni10-Cr0.15-APT |
6.9 |
72.8e6* |
110 |
1.4e-6 |
6.3e-9 |
|
8- SB-Ni10-Br-Ni5-HS-Ni1.5-Cr0.15-APT |
1.9 |
1.3e6 |
119 |
3.3e-6 |
11.1e-9 |
The Bode representation is shown in Figure 11 for frequencies (a) between 1 MHz to 100 mHz and (b) 3 MHz to 45 mHz. The time constant at higher frequencies (about 106 Hz) could be associated with a passivated chromium layer, such as defects, microporous, and micro-cracks [7, 8]. The low phase angles are related to the thickness of the oxide layer [9]. As shown in Figure 11b, the anodic post-treated samples have a lower phase angle at higher frequencies than the other samples. Because of the presence of phosphorous and cobalt in the oxide layer, the chromium oxide layer of anodically treated samples may have different physical properties. The second time constant indicate a different expectation of corrosion behaviors on the passivated areas [7] which is in accordance with linear polarization results.
 from the equivalent electrical circuit for SB-Ni10-Br-Ni5-HS-Ni1.5-Cr0.15. Resistance of electrolyte 5.25 ohm, Charge transfer resistance 129 ohm. Impedance spectroscopy was carried out in 5 % sodium chloride solution (pH = 6.8) at 35 °C") Fig. 8: The magnified shape of the fit on the Nyquist plot (red points on the blue curve) from the equivalent electrical circuit for SB-Ni10-Br-Ni5-HS-Ni1.5-Cr0.15. Resistance of electrolyte 5.25 ohm, Charge transfer resistance 129 ohm. Impedance spectroscopy was carried out in 5 % sodium chloride solution (pH = 6.8) at 35 °C
Fig. 8: The magnified shape of the fit on the Nyquist plot (red points on the blue curve) from the equivalent electrical circuit for SB-Ni10-Br-Ni5-HS-Ni1.5-Cr0.15. Resistance of electrolyte 5.25 ohm, Charge transfer resistance 129 ohm. Impedance spectroscopy was carried out in 5 % sodium chloride solution (pH = 6.8) at 35 °C
 at 35 °C") Fig. 10: Nyquist plot of chromium coated samples for the frequency range of 3 MHz to 45 mHz. Impedance spectroscopy was carried out in 5 % sodium chloride solution (pH = 6.8) at 35 °C
Fig. 10: Nyquist plot of chromium coated samples for the frequency range of 3 MHz to 45 mHz. Impedance spectroscopy was carried out in 5 % sodium chloride solution (pH = 6.8) at 35 °C
 Fig. 9: Equivalent circuit by considering electrical elements such as a Warburg impedance element related to diffusion, a capacitor, and a resistor related to an oxide layer. R1: Electrolyte resistance, R2: Charge transfer resistance, Q1: Capacity of double layer. W1: Warburg element for modeling diffusion behavior, R3: Resistance of oxide layer, Q2: Capacity of oxide layer
The fitted equivalent circuit parameters for some of the deposited samples are listed in Table 6.
A higher resistance indicates a lower current flow in corrosion. As a result, the anodic post-treated samples should have a lower corrosion current and a higher oxide layer resistance, which is in accordance with linear polarization results (see corresponding chapter).
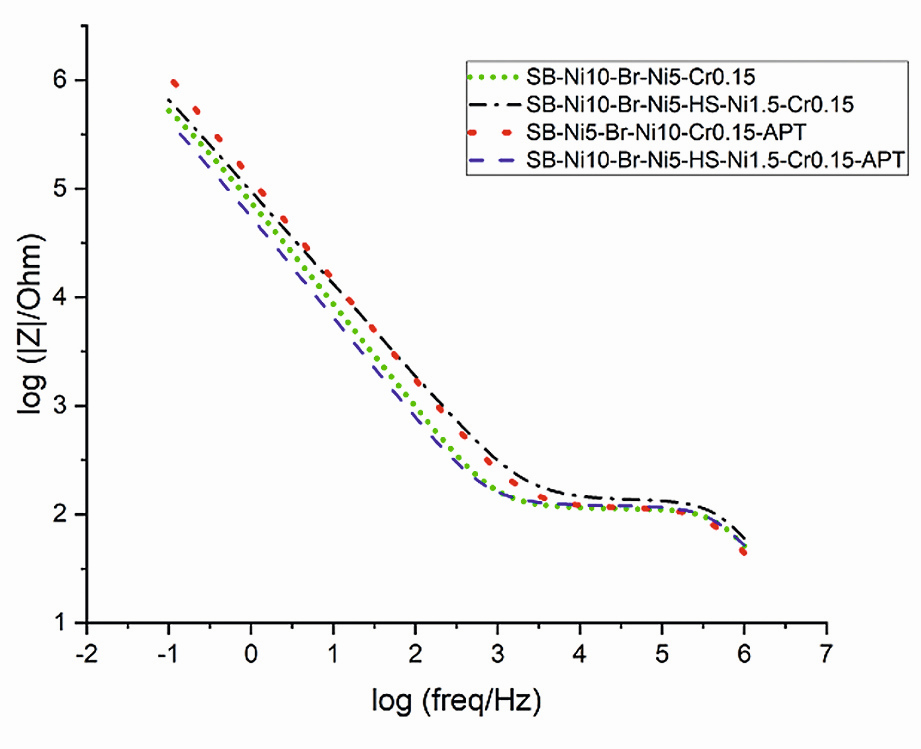

Fig. 11: Bode plots of chromium coated samples in the range of (a) 1 MHz to 100 mHz, (b) 3 MHz to 45 mHz frequencies. Impedance spectroscopy was carried out in 5 % sodium chloride solution (pH = 6.8) at 35 °C
Conclusions
Due to the limitations on the use of hexavalent chromium, the use of trivalent chromium electrolytes is recommended. However, deposits from trivalent chromium electrolytes have lower corrosion resistance. Various methods have been suggested for increasing the corrosion resistance of this layer. Electrodeposition of an additional microcracked chromium layer could significantly improve the corrosion resistance. Various post-treatments of the chromium layer are also recommended to produce a thicker oxide layer on the surface to increase the corrosion resistance of chromium (III) based coatings. This research investigated at the effect of an anodic post-treatment on the corrosion behavior of micro-cracked and conventional chromium (III) based coatings. STEP test, accelerated salt spray testing, Linear polarization and impedance spectroscopy were used to assess the corrosion resistance of the specimens. According to the polarization test, the corrosion resistance of all specimens with a thicker bright nickel layer is higher than the specimen with a thicker semi-bright nickel layer.
The results also demonstrated that anodic post-treatment of deposits could significantly reduce corrosion rates and provide additional protection to duplex nickel/chrome deposits. The corrosion resistance data from salt spray testing cannot be directly compared to the results obtained from other electrochemical methods. However, the results of the individual technique corrosion tests did not show a significant improvement in corrosion resistance for the anodic treated micro-cracked chromium coatings.
Literatur
[1] O. Sadiku; E.R. Sadiku: Influence of Operation Parameters on Metal Deposition in Bright Nickel-plating Process, Portugaliae Electrochimica Acta, 29(2), 2011, 91–100
[2] T. Dobrev; M. Monev; S. Nikolova; St. Rashkov: Evaluation of the corrosion protection properties of multilayer Cu/Ni/Cr deposits, Surface and Coatings Technology, Vol. 29, 1986
[3] M. Barnstead; J. Schweitzer: Investigations into the Performance of Multi-layer Nickel Coatings in Both CASS and Exhaust Gas Corrosion Testing, Mac Dermid, Inc., Waterbury, Connecticut, USA, 2010
[4] B. Özkaya: A method for electrolytically passivating an outermost chromium or outermost chromium alloy layer to increase corrosion resistance, Atotech Deutschland GmbH, 2018
[5] R. Tremmel; A. Brownstown: Semi-bright nickel plating bath and method of using same, European patent specification, EP2683853, 2017
[6] L. Xu; L. Pi; Y. Dou; Y. Cui; X. Mao; A. Lin; C. Fernandez; C. Peng: Electroplating of Thick Hard Chromium Coating from a Trivalent Chromium Bath Containing a Ternary Complexing Agent: A Methodological and Mechanistic Study. ACS Sustainable Chem. Eng. 2020, 15540–15549
[7] O.J. Suarez; J.J Olaya1; M.F. Suarez; S.E. Rodil: Corrosion resistance of decorative chromium films obtained from trivalent chromium solutions, Journal of the Chilean Chemical Society, 2011
[8] O. Gebhardt: A phase reference procedure for interpretation of impedance spectroscopy experiments. Electrochemical Acta Vol 38, 1993
[9] H. Hernández; A. Reynoso; J. Gonzalez; C. Moran; J. Hernandez; A. Ruiz; R. Cruz: A Review Study of Basic Aspects of the Corrosion Mechanism Applied to Steels, Electrochemical Impedance Spectroscopy (EIS), 2020