The good news is that global copper reserves will last for around 40 years at current consumption levels. The resources, which also include non-commercially mineable deposits, are estimated to last for over 200 years. The bad news: global copper production in 2023 was 22.6 million tons plus recycled copper, but consumption was 26.6 million tons.
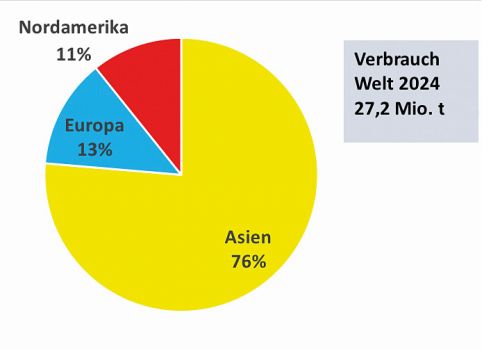
Consumption is expected to reach 27.9 million tons this year and grow to 32.6 million tons by 2035(Fig. 1 + 2). However, the rapid increase in production volume is limited and it is expected that rising demand could lead to a supply bottleneck and thus rising prices.
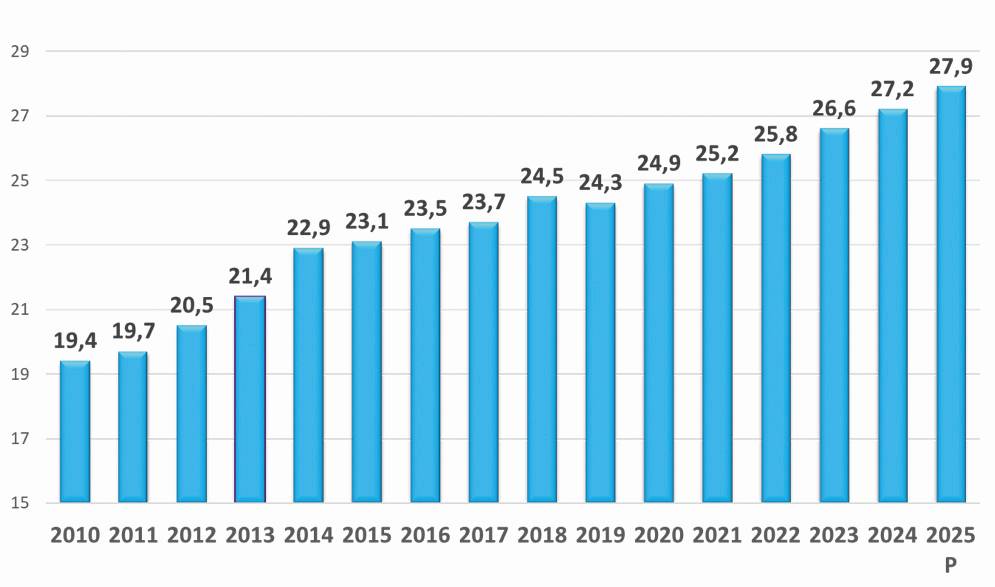 Fig. 1: Global copper demand 2010 - 2025 in million tons (ICA data)
Global trends influencing the copper market
Europe: European copper consumption is increasing due to the focus on energy security (grid expansion), including initiatives to ensure that 45% of energy in Europe comes from renewable sources. In addition, there is a growing market for battery electric vehicles (BEV).
China: Decline in demand for copper, as economic growth will be slower over the next three decades than in the last 20 years. Economic growth will change from an investment-driven (expansion of infrastructure and plant technology) to a consumption-driven development that is less copper-intensive. Short-term: Investments in renewable energies such as wind turbines and the rapidly increasing share of new electric vehicles (NEV = battery electric + hybrid) are driving copper demand.
North America: Long-term copper demand will increase due to the following factors:
- Relocation and expansion of domestic production
South & Central America: Consumption of refined copper will increase due to the following factors:
- New capacities in the renewable energy sector
- Expansion of the Brazilian automotive industry
India: Further increase in copper consumption since 2022 due to
- expected tenfold economic growth by 2050, driven by a rapidly growing and urbanizing population
- a growing industrial sector and renewable energy infrastructure
Northeast Asia (Japan): Copper consumption could decline due to demographic changes leading to lower consumer demand. In contrast, floating offshore wind turbines will become an important component of renewable energies and thus a growth market.
ASEAN (Australia): Copper demand is expected to triple by 2040 due to urbanization, population growth and the development into a global manufacturing hub. Automotive production is an important end-use sector for copper cables in this region.
Copper prices and US tariffs
According to an analysis by J.P. Morgan Research, copper prices will average 8,300 $/t in mid-2025. This is based on a reduced demand forecast - demand is currently expected to grow by 1.9% year-on-year, which is 1% below previous estimates. This would result in a surplus of around 170,000 tons for 2025 as a whole. The US Department of Commerce is currently investigating US copper imports. A tariff of at least 10% is generally expected.
Copper prices rose by around 12% from January 1 until the announcement of the tariffs on Liberation Day, after which they corrected by 11%. The global slowdown in growth caused by the US tariffs is likely to have a negative impact on prices in the short term.
Demand from China and purchases to build up stocks have pushed copper prices back above 9,000 $/t in some cases. However, the expected decline in global demand will soon overcompensate for China's currently solid fundamentals and push prices down again.
Copper production and supplier countries
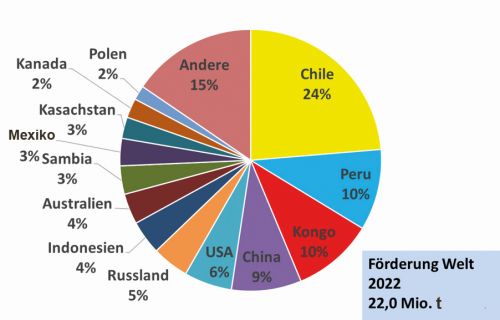
Copper is one of the most important industrial metals and is mined in numerous countries around the world. The most important producing countries are(Fig. 4):
Chile: By far the largest producer, responsible for around 24% of global copper production
Peru: The second largest copper producer, with a share of around 10%
China: Important producer, 9%, world leader in copper refining, i.e. the process for extracting and purifying copper from ore, and also a major consumer
USA: Also significant at 6%, mainly due to mines in Arizona and Utah
Indonesia 4%, Australia 4% and the Democratic Republic of the Congo with an increasing share of 10%
Around 22 million tons of copper are mined worldwide every year, with a mine capacity of 27 million tons.
In 2024, almost 27.2 million tons of copper were consumed worldwide, and consumption of 27.9 million tons is forecast for 2025.
Price development of copper (2010 - 2025)
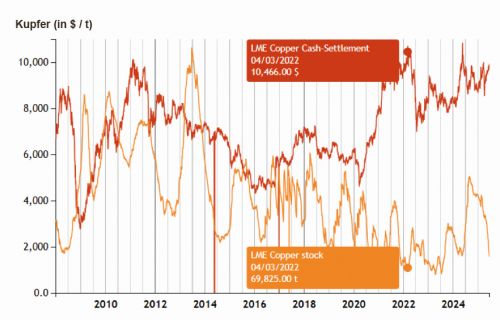
The copper price is strongly influenced by supply, demand, economic development and geopolitical factors. In the 1980s and 1990s, the price of copper on the LME remained fairly constant at between USD 2000 and USD 3000 per tonne. It was only with the advancing electrification and expansion of infrastructure in China, as well as trading by financial investors, that the ups and downs began.
Here is an overview:
2010-2011: The price rose to around $9,000 - $10,000/t, driven by global demand and investment.
2012-2015: Slight fluctuations, prices ranged between $6,000 - $7,500/t.
2016-2019: Recovery after the slump, prices hovered around $5,500 - $6,500/t.
2020: Due to the COVID-19 pandemic and economic uncertainties, the price fell to around $5,000/t
2021-2022: Strong demand, primarily due to the expansion of renewable energies and electromobility, led to a price increase to $9,000 - $10,000/t.
2023-2025 (forecast): Expected price increases due to supply shortages and rising demand, with prices around $9,500 - $11,000/t.
Conclusion
The highest copper price per tonne on the London Metal Exchange (LME) was reached on May 20, 2024 at $10,857. This value is the current all-time high for copper on the LME(Fig. 5).
Copper production is growing steadily, especially in Chile and Peru. Prices have fluctuated considerably in recent years, but have remained at a high level overall, which underlines the importance of the metal for the global economy.
The energy transition in China, Europe and North America is leading to an increase in overall demand for copper and will thus offset the decline in growth in traditional demand. As renewable energy systems are more copper-intensive, CRU Research estimates that renewables could contribute up to 5.6 million tons to total copper demand between 2020 and 2040.
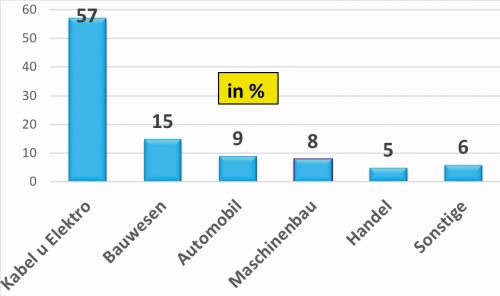
Total demand for wires and cables due to the energy transition is expected to increase from 0.8 million tons to 6.7 million tons between 2020 and 2040, which corresponds to a compound annual growth rate (CAGR) of 11%(Fig. 3).
Sales of copper-intensive electric vehicles (EVs) are expected to reach 70 million by 2040, with New Electric Vehicles (NEVs) accounting for 85% of total sales. However, technological advances in the automotive industry are expected to lead to a reduction in the copper intensity of EVs.
In a nutshell
- At the current rate of consumption, global copper reserves will last for around 40 years based on utilized extraction sites, but are estimated to last for 200 years with further exploration.
- Consumption is expected to reach 27.9 million tons this year and grow to 32.6 million tons by 2035. This compares to production of around 23 million tons, with a production capacity of 27 million tons.
- US tariffs of at least 10% on copper imports to the USA are unsettling the market.
- The highest copper price per tonne on the London Metal Exchange (LME) was reached on May 20, 2024 at USD 10,857.
According to the EU, copper is a potentially critical metal and is also listed as such in the EU's Critical Raw Materials Act (CRMA) because copper is a strategic raw material. Here too, dependence on China should not be neglected, as China dominates global copper refining with around 10 million tons and its own production of 1.9 million tons.
I wish you a relaxing vacation season
Please stay with us
Yours
Hans-Joachim Friedrichkeit


