
As part of the IGF project ETRACE, a large number of features were identified as test criteria for the originality verification (authentication) of electronic hardware and assigned to the four relevant integration levels of electronics.
As part of the IGF project ETRACE, a large number of features were identified as test criteria for the originality verification (authentication) of electronic hardware and assigned to the four relevant integration levels of electronics.
Test methods were found and evaluated for the features, with the focus on a high level of recognition reliability. With regard to authenticity checks, statistically verified, simple methods such as weighing or geometric measurement are very effective, as they reveal deviations that are far greater than the variation in characteristics. In particular, the quantitative evaluation of X-ray images can guarantee a very reliable inspection even with simple 2D fluoroscopy. Spectroscopic methods can ensure material originality, but are preparatively complex and capital-intensive, whereby the established FTIR is the reference method. With regard to the determination of absolute material compositions, X-ray methods such as EDX and XRF are highly accurate and particularly suitable for inorganic components. The accuracy and probability of originality testing can be significantly increased by combining several simple methods such as weighing and length measurement, i.e. redundancy. For identification purposes, optical and X-ray optical methods that target indirect features that can be controlled during the manufacturing process, such as surface roughness or pores, have great potential for identifying individual electronic components.
1 Introduction
 Fig. 1: Concept for the use of intrinsic features for the identification and authentication of electronic productsCounterfeitingcan affect every level of integration of electronics, from unpackaged chips to encapsulated integrated circuits and devices(Fig. 1, 2). The German Electrical and Electronic Manufacturers' Association (ZVEI) published recommendations for action to reduce the risk of counterfeit components back in 2011 [1]. In 2013, VDE and IEC published a strategy paper [2] in which the scope of counterfeiting and piracy was estimated at over 650 billion US dollars per year. Counterfeit products generally do not meet the specified standards and can therefore pose considerable safety risks.
Countermeasures include the 'development of an anti-counterfeiting strategy' and 'the use of covert and overt technologies to protect against counterfeiting'. The research project on which this publication is based should lead to authentication methods that enable secure and efficient differentiation between counterfeit and original electronic products.
Current authentication methods are often based on marks that are additionally attached to the product. Although extrinsic features such as holograms or serial numbers increase the effort and risk of detection in the case of product counterfeiting, authentication methods that cannot be deceived and whose principle is based on features that cannot be falsified appear to be better. Physical unclonable functions (PUF) of integrated circuits (IC) fulfill their purpose well by creating a unique digital fingerprint for each chip [7]. Unfortunately, the associated test procedures are complex and sometimes require chip-integrated test structures. This limits the usability of PUFs. In order to provide intrinsic features with the potential for use in identification and authentication, packaging technology (AVT) with its wide range of methods is the ideal solution.
 Fig. 2: Classification into product classes according to integration levels 0 to 3 of assembly and connection technology
The Society of Automotive Engineers proposed the standard SAE 6171 'Counterfeit Test Evaluation Method' as a collection of standardized analysis methods for suspected counterfeiting [6], which focuses on hardware. This was used to implement an online tool based on data collected to date(Tab. 1).
|
1 |
External Visual Inspection (EVI) |
2 |
X-Ray Fluorescence (XRF) |
|
3 |
Delid/Decapsulation Physical Analysis (DDPA) |
4 |
Radiological Inspection (RI) (X-ray) |
|
5 |
Acoustic Microscopy (AM) |
6 |
Electrical Test |
|
7 |
Raman Spectroscopy |
8 |
Fourier Transform Infrared Spectroscopy (FTIR) |
|
9 |
Thermogravimetric Analysis (TGA) |
10 |
Design Recovery (DR) |
Intrinsic characteristics are properties that can be measured and are present in a product as a result of production without further intervention. A 'direct characteristic' is a controllable process variable. An 'indirect characteristic' is an uncontrolled process artifact and has a high degree of randomness. It can therefore be used to create fingerprints. 'Authentication and identification' are the two fundamental issues in connection with counterfeit detection. The purpose of 'authentication' is to verify that a component or a sample belongs to a basic set. The latter can be represented, for example, by a manufacturer, a production line, a component series or even a specific machine. 'Identification' clarifies the question of whether a particular individual is uniquely known.
2 Aims of the research project
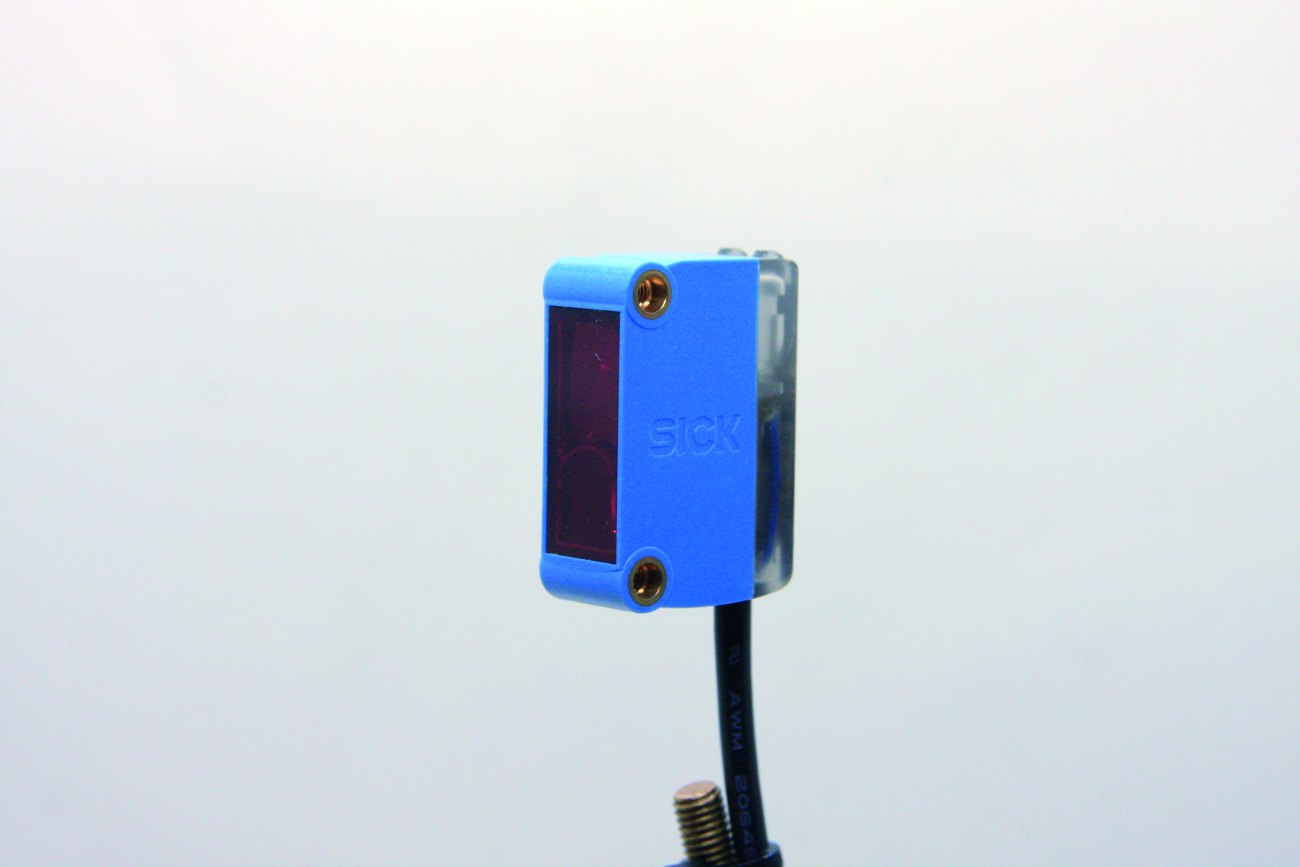
The aim of the ETRACE project was to demonstrate and validate a method for securing a supply chain based on intrinsic AVT characteristics on electronic components. This strategy is based on the fact that the characteristics are recorded by an authorized body, e.g. the original manufacturer, and stored in a database in the form of a digital fingerprint(Fig. 1). During the identification or authentication process at the customer's premises, the characteristics are recorded again by means of testing. The originality of the product is to be verified by comparison with the stored data record, independently of the intermediate trade stages.
Five important properties are required for the techniques to be used, such as low inspection costs (logistics, time, capital), automation capability, fast and non-destructive 100% inspection and reliable detection of the relevant counterfeit features. The desired project results were information on which product features are suitable, the associated measurement technology and performance characteristics such as detection reliability, pseudo error rate, inspection speed and cost-effectiveness. The overview of the investigated methods was summarized in a guideline.
3 Investigations carried out
3.1 Test objects, AVT processes, features
The project aims to develop a counterfeit detection system for the widest possible range of electronic products. In the present work, we assume four established integration stages of AVT, i.e. bare chips, individual components, assemblies and packaged end products. Relevant product examples were identified for each of these together with the PA(Fig. 2).
The products to be examined were divided into four product classes along the value chain according to their integration stages(Fig. 2). For each product class, assembly and connection technology processes were then identified that essentially run through all relevant products or product groups in a product class. Suitable parts were provided by the members of the project support committee (PA) for further investigation and additional products were obtained from the trade. The plan to obtain counterfeit products seized by customs for analysis purposes could not be realized despite good relationships, as there are organizational and legal obstacles to this.
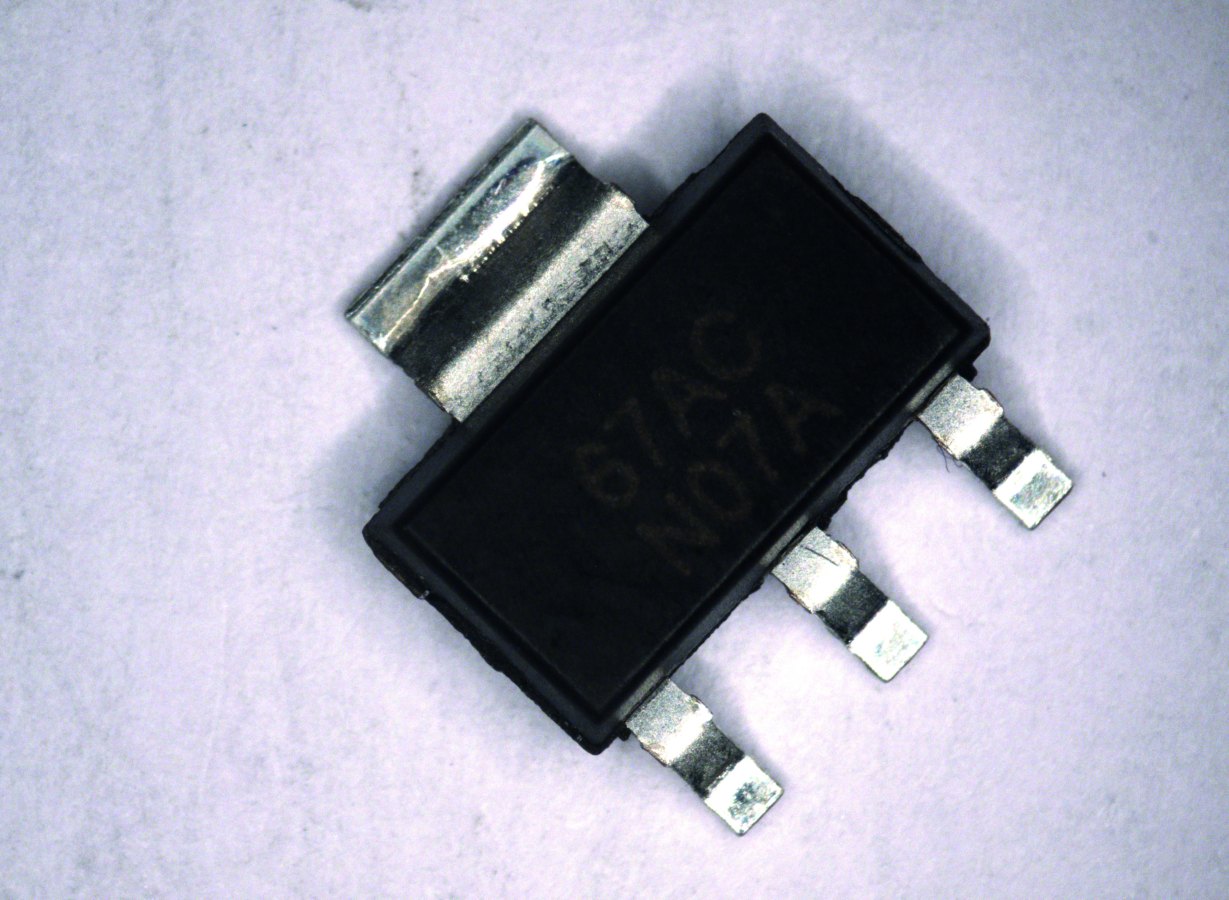
With the LM317EMP, a voltage regulator was seized from a PA member that was found to deviate significantly from the manufacturer's specifications during production. Independent investigations had revealed that the components used were counterfeit. These components formed the basis for further in-depth investigations(Table 2).
|
Integration level1 Components |
Integration level 3 Device |
|
LM317 EMP |
Sick GL6 |
3.2 Characteristics and test methods
In a preliminary investigation, intrinsic characteristics were identified for each process step for the integration levels and measurement methods were assigned. Procedures for detecting counterfeit-relevant features are ideally already implemented in production or quality assurance. Cameras and AOI systems, X-ray systems and digital microscopes are standard technology in modern companies and should be considered in more detail for the detection of intrinsic characteristics:
- X-ray processes
- Imaging optical processes, in particular automatic optical inspection systems (AOI) and optical microscopes
- profilometers
- Spectrometers in the range from UV through the visible range to infrared
- Thermal analysis (DSC, TGA)
- Mechanical measurement technology with precision scales, analytical scales, calipers, micrometer screws, measuring probes and measuring microscopes
This resulted in a total of 25 test methods to be considered.
4 Results
4.1 Light spectroscopy of polymers
Spectrometry is a method for determining the energy-dependent or wavelength-dependent intensity of light [8]. Spectra are analyzed according to emission, absorption, scattering or reflection. Absorption of radiation in the material is described by Lambert-Beer's law, whereby the absorption coefficient depends on the wavelength λ.
Technical polymers have a complex structure. The housing of the GL6 light barrier consists of a thermoplastic with the components polystyrene (PS), polycarbonate (PC) and polybutadiene (PB). Other components are glass fibers, mineral fillers and a blue dye. These interact with light in the wavelength range from UV to infrared. In addition, a specific surface topography results, which depends on the filler particles and the surface quality of the injection mold.
Visual assessment and microscopic camera images showed no difference in the blue housing color of the three comparison samples in direct comparison. Further investigations included color measurements, Raman spectroscopy, FTIR spectroscopy in transmission and reflection and reflectance measurements from UV to IR.
The logo of the original manufacturer was injection molded onto all components. The fine structure of the original and plagiarized parts is clearly different(Fig. 3). The original is heterogeneous in color, blue-white marbled. The white lines are probably glass fibers. The surfaces of the two plagiarisms are indistinguishable. They are smoother and more homogeneous than the original.


Fig. 3: Surfaces of Sick GL6 sensor housing; from left to right: original, counterfeit 1, counterfeit 2
It was not possible to differentiate only by color. This applies to both visual observation and with the most sensitive color measurement systems on the market. The color difference is dE < 0.01. Thus, no significant color differences were measurable. Distinguishability was slightly better on granules.
As the same color can be set with different spectral compositions, measuring the wavelength-dependent intensity appears suitable for detecting hidden differences in the spectrum. It is possible to evaluate spectra according to reflection, transmission or absorption. Although the various methods were able to detect differences in individual cases, none of them are classified as suitable for a wide range of applications. Only FTIR [9] (Fourier-transformed infrared spectroscopy) showed very good differentiation. FTIR can be regarded as a reference method for analyzing polymer materials. The availability of commercial databases with spectra of various substances [10] makes it possible to identify plastics by polymer type, manufacturer, type and variant without having to measure reference samples. The FTIR diagrams identify silicon oxide in all samples and water adsorbed on it. The peak of the flame retardant antimony oxide is missing in the spectra of the counterfeits.
Thus, the suitability of FTIR as a reference method for authenticity testing of materials was very well confirmed by our investigation without recourse to a commercial database and in comparison to the original sample. To avoid time-consuming sample preparation prior to FTIR transmission measurements, experiments were also carried out with FTIR in reflection. Characteristic spectral signatures of the functional groups were not clearly distinguishable. FTIR in reflection therefore does not appear to be a suitable method. A compromise between preparative effort and accuracy could be the transmission on microtome thin sections, but this was not tested here.
We do not recommend any other spectroscopic methods in the ultraviolet to infrared wavelength range at this point.
4.2 X-ray spectrometry
Energy dispersive X-ray spectroscopy (EDX, EDS) is an analytical method of chemical composition integrated into the scanning electron microscope (SEM) [11]. Elements with atomic numbers Z>10 can be analyzed at depths of up to a few micrometers. To prevent electrostatic charging, a thin layer of graphite is vaporized, which impairs the C analysis.
The overview of the elements in Table 3 lists the atomic contents in the casing samples. In addition to carbon and oxygen, silicon is also present in all of them, typically in the glass fibers. Only the original contains bromine and antimony, the flame retardants. Tetrabromobisphenol A (TBBPA) is contained in ABS [12] and antimony trioxide (SbO3) in ABS and PC. The combination of both substances is common [13]. Sulphur, a cross-linking agent in the polymerization of ABS, was detected in both counterfeits [14].
|
Element |
Original at-% |
Plagiarism S03 at-% |
Plagiarism S21 at-% |
|
C |
91,2 ± 0,80 |
90,9 ± 0,40 |
91,5 ± 0,4 |
|
O |
6,90 ± 0,80 |
8,8 ± 0,40 |
8,4 ± 0,3 |
|
Si |
0,25 ± 0,11 |
0,19 ± 0,04 |
0,12 ± 0,04 |
|
Br |
1,46 ± 0,11 |
- |
- |
|
Sb |
0,19 ± 0,04 |
- |
- |
|
S |
- |
0,14 ± 0,02 |
0,05 ± 0,01 |
EDX spectra show that the original contains the flame-retardant elements bromine and antimony, which are missing in the counterfeits. A different polymerization scheme based on sulphur was obviously used in both plagiarisms. In principle, it has been confirmed that EDX can be used to differentiate the materials very well with regard to heavier elements. The scattering of the absolute contents was between 0.04 at-% and 0.8 at-% and relatively between 0.4 % and 40 % at the lower detection limit. The absence of flame retardants is consistent with the results of the FTIR analysis. The falsifications therefore also represent a safety risk.
4.3 Thermal analyses: TGA and DTA
 Fig. 4: TGA of original, S03 and S21Thermogravimetricanalysis (TGA) and differential thermal analysis (DTA) are two common polymer analyses. TGA measures the change in weight of a sample when heated with oxygen. During pyrolysis, a sample releases energy and reduces its mass. DTA determines the endothermic or exothermic energy conversion of the sample during heating. This allows the combustion energy, temperature, plastic content and glass transition temperature to be determined.
For the TGA measurements, 15 mg of polymer powder was placed in a crucible in the TGA-DTA device (Netzsch STA 409C). Heating up to 650 °C was carried out at a rate of 10 K/min in air. After TGA, the residual powders were analyzed again using FTIR (Bio-Rad FTS 3000 Excalibur series). Figure 4 shows a characteristic weight loss curve for originals and counterfeits. For all three products, an incombustible residue remains after pyrolysis. This is 21 % in the original and 13 % each in S03 and S21. The lower gradient of weight loss between 300 and 400 °C in the original may be due to the flame retardants TBBPA and Sb2O3 [15].
ABS already pyrolyzes below 400 °C, while polycarbonate is stable up to 500 °C. There is therefore a plateau between 400 and 550 °C. The proportions of PC and ABS can be calculated from the weight changes. The mass fraction of ABS is lower in the original and that of PC is higher than in S03 and S21(Table 4). This is consistent with the result of the FTIR analysis.
|
Component |
Original (%) |
S03 (%) |
S21 (%) |
|
Remainder |
21,0 ±0,3 |
12,9 ±0,8 |
13.0 ±0,6 |
|
ABS |
48,5 ±0,1 |
69,4 ±0,6 |
69,4 ±0,8 |
|
PC |
30,5 ±0,3 |
17,7 ±0,2 |
17.6 ±0,4 |
 Fig. 5: Distribution functions of the masses of the LM317EMP voltage regulators in the SOT223 package on originals and plagiarisms. X-axis: mass in mg
The DTA results, which are not shown, are much more scattered in comparison with the TGA. The peak of ABS combustion occurs around 350 °C in the DTA diagram of the original, but around 420 °C in the counterfeits S03 and S21. In summary, pyrolysis in the TGA is well suited to clearly differentiate between original and counterfeit engineering thermoplastics. The mass changes in TGA allow the quantitative determination of polymer and inorganic components. Analysis of the residues using FTIR or EDX identifies these more precisely than on the polymer components.
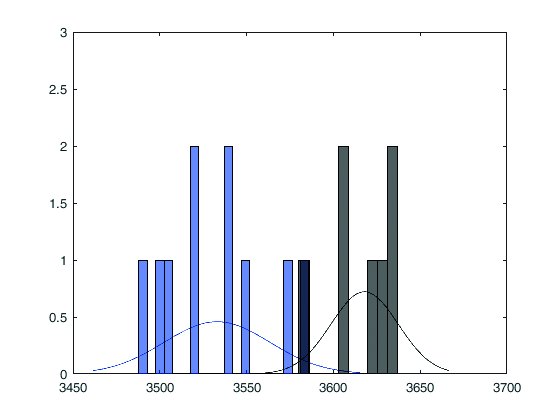

Fig. 6: Scattering of the lengths (left) and widths (right) of the LM317EMP voltage regulators in the SOT223 housing on original black and plagiarism blue. X-axis: Dimension in µm
5 Mechanical dimensions
5.1 Mass
 Fig. 7: X-ray image of original LM317EMPFigure 7 shows the X-ray radiographs of the LM317EMP voltage regulator, a component in the SOT223-4 package. The design is standardized according to JEDEC [16], whereby the dimensions are defined within narrow limits. The mass is therefore largely determined by the internal structure. The weight-relevant elements are the silicon chip, the copper lead frame and the molding compound (silicon oxide in an epoxy matrix). The bonding wires with diameters of 25 µm, the epoxy adhesive diebond layer and the tin plating contribute only slightly to the mass.
Original components from a PA-Eltroplan were provided for the investigation, as well as a variant of the counterfeits. A further original part was obtained from a large distribution company, a second counterfeit from Ebay. The components were weighed on a Wipotec MTC50/30-FS precision scale. Its measuring accuracy is characterized by a 3? spread of ± 5 ? characterized. The sample size was four to 10 samples.
The results are shown in Figure 5. The masses of the plagiarized samples are significantly smaller than those of the originals. While the masses of the two original batches differ by less than one standard deviation of approx. 1.5 mg, the counterfeits are approx. 10 mg and 20 mg lower. It is noteworthy that one counterfeit has a significantly higher standard deviation of approx. 2 mg, while this is lower for the second counterfeit than for the originals.
Originals and counterfeits can therefore be easily distinguished by plotting the distribution curves. Mass determination is suitable for testing the conformity of a test batch or even a single sample with originals, also because the test equipment scatter of a precision balance is only negligibly small. Investment costs and measuring effort are low, samples do not have to be prepared and can be reused. In summary, it is a cost-effective, efficient method for authentication.
6 Geometric parameters
The width and length of the original and counterfeit LM317EMP components were measured in a camera using the NeuroCheck software with an accuracy of approx. 12 µm. It can be seen(Fig. 6) that the counterfeit components are on average 2.7 % smaller than the originals. There is an overlap in the distributions (black: originals, blue: counterfeit). The housing dimensions scatter in a bandwidth of around 100 µm, whereby they tend to be evenly distributed in both batches and are much more narrowly tolerated in the originals.
Dimensional measurement is an economical and quick method of checking for authenticity. The length characteristics can be combined with the weight measurement, which provides even better differentiation. The combination of several dimensions results in a higher probability of detection. It is also clear that simultaneous 'trimming' of several features to the original value significantly increases the effort involved in forgery or makes it almost impossible.
7 Internal features (X-ray analysis)
X-ray analysis (radiography) was used to clarify the extent to which the internal structure of components provides information about differences to an original component taken as a reference. For the investigation, original components and the two counterfeit variants described were examined. M317EMP components were X-rayed using a standard industrial X-ray machine of medium quality. The size of the digital images was 512*512 pixels. The qualitative comparison of the X-ray images(Fig. 7, 8) reveals a whole series of features from the inside of the package that can be evaluated quantitatively(Table 5).
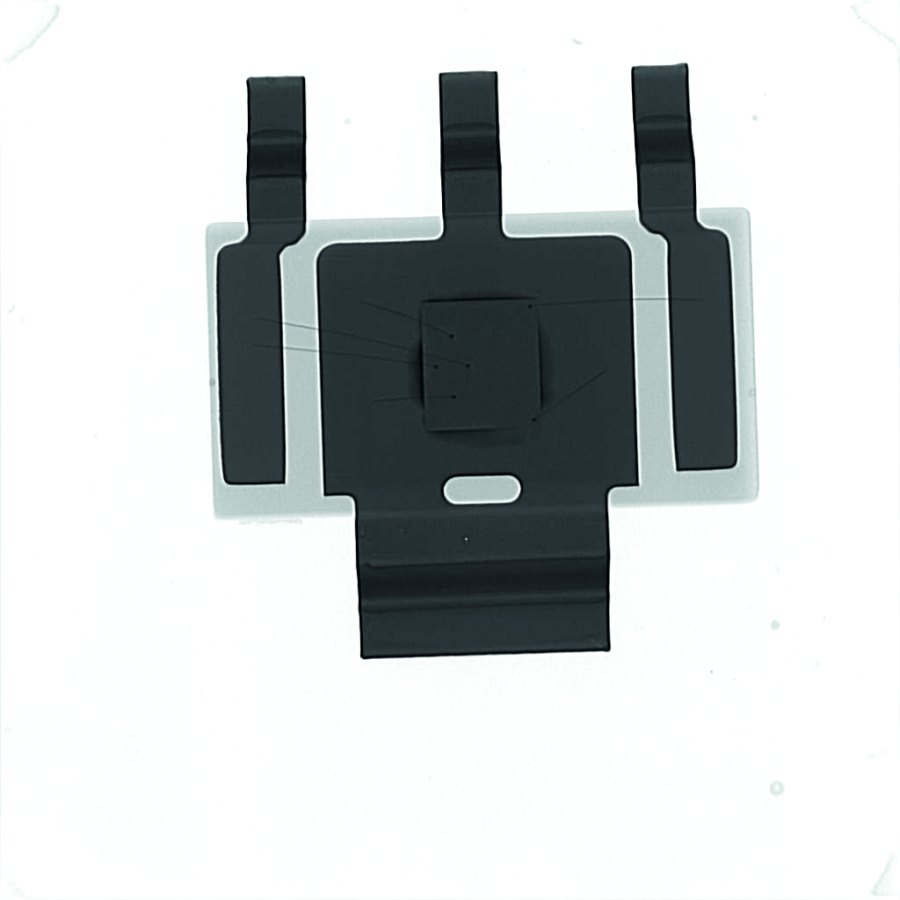

Fig. 8: X-ray images of counterfeit LM317EMP
The observed differences can be quantified as geometric quantities. Here too, the deviations between the dimensions are at least one order of magnitude higher than the resolution of the measurement. At the present magnification, one pixel measures about 20 µm, which is taken here as the length resolution. Radiography is also very well suited for overview images in order to classify originals and forgeries on the basis of discrete length distributions. The features shown can be automatically extracted from images using standard image processing methods [17].
|
Package element |
Feature |
Quantity |
|
Leadframe central |
Shape, width, length, anchor hole: shape, position X,Y, diameter, |
> 5 |
|
Leadframes lateral |
Length, width, anchor structures left and right: presence, position X,Y, shape, length, width |
> 8 |
|
Chip |
Length, width, central position X, central position Y |
4 |
|
Bond wires |
Number, diameter, per bond wire Start position X, Y, end position X,Y |
2 to 26 |
|
Total: |
19 to 43 |
The approach of classifying originals and forgeries based on deep learning approaches with neural networks was also investigated on the X-ray images. The study also showed that AI methods offer great potential and can even be implemented with limited effort [18]. This will be reported on in a separate publication.
7.1 Evaluation of the authentication methods
The security of the developed authentication against forgery is evaluated on the basis of several parameters: Statistical tests such as the t-test or the chi-square test can be used to check for (non-)matches. This provides information about the detection reliability and the pseudo error rate of the respective authentication method. A test method is suitable if the differences are so large that discrimination is reliably possible despite the scattering. The difference between the feature and the original should be large, while the measurement error and the standard deviation of the measurement should be small(Table 6). Two other key criteria are the investment required for the associated measurement technology and the measurement effort itself. The latter essentially determines the variable costs and takes into account aspects such as the preparative effort, throughput and automation capability. Among other things, the question of whether the test is a non-destructive test (NDT) is of great importance for the test strategy.
|
Feature |
Color |
IR spectrum |
Thermal analysis TGA, DSC |
Chemical composition |
Mass Weighing |
External dimensions |
Internal dimensions |
|
Characteristic deviations |
Very low |
Very small |
Very small |
Significant |
Significant |
Significant |
Significant |
|
Variance d. M. |
Low |
Medium |
Medium |
High |
|||
|
Measurement error |
Low |
Low |
Medium |
Low |
Very low |
Low |
Low |
|
Measurement technology |
Color spectrometer, visual Camera |
FTIR |
Weight loss calorimetry |
XRF* EDX** |
Precision balance |
Optical mechanical |
2D X-ray, X-ray tomography |
|
Non-destructive |
Yes |
No |
No |
Conditional |
Yes |
Yes |
Yes |
|
Measurement effort |
Very low to low |
Transmission: High Reflection: Low |
Medium |
High |
Low |
Low to medium |
Medium to very high |
|
Equipment costs |
Low to high |
High |
High |
High |
Low/ Moderate |
Low to medium |
Medium to very high |
|
Suitability for authentication |
- |
|
|
|
|
|
|
|
Remark |
Exact color shade is very easy to falsify |
FTIR in transmission is reference method |
Deviation indicates non-originality |
XRF is reference method for inorganics |
Simple, fast method Combination with other methods |
Simple, fast method in combination with other methods |
Reference method, also as individual method, can be automated |
* X-ray fluorescence XRF, ** Energy dispersive X-ray spectroscopy EDX
The authentication methods are considered individually below(Table 6):
- Color measurements and visual assessments are in principle well suited to detect even minor differences in direct color comparison. However, it has been shown that housing colors are almost perfectly falsifiable despite different dye chemistry. Color comparison requires a high degree of absolute accuracy from manufacturers and customers, which can only be guaranteed by sophisticated measuring devices(Table 6).
- Absorption spectrometers and reflection spectrometry were less suitable; the evaluation with the Raman spectrometer also only led to limited success. Material analysis of polymers and composite materials with FTIR and material identification from a library are state of the art. FTIR spectra cannot be falsified with reasonable effort. Unfortunately, transmission FTIR is destructive and preparatively complex; the more efficient FTIR in reflection unfortunately did not yield any usable results.
- Thermal analyses (thermogravimetry and calorimetry) through to pyrolysis can be considered suitable for detecting different materials. Material deviations are clearly detectable and inorganic fillers can be quantified well after decomposition of the matrix. However, the methods are destructive.
- A suitable method for determining the elemental composition is X-ray spectroscopy, both for excitation with the electron beam in the SEM with EDX and for X-ray fluorescence (XRF). Both can quantify elements above an atomic number of Z = 10 with high precision in some cases. It has been observed that housing materials on forgeries contain other or no flame retardant elements (bromine, antimony oxide) or that unauthorized lead-containing solders were used. As a rule, these samples are lost after the test.
- Weighing is an excellent method for the quantitative determination of characteristics. It is characterized by high absolute accuracy and low measuring equipment dispersion, so that even small differences become significant. The method requires neither high investment nor special preparation and can be easily automated. In principle, it seems possible for counterfeiters to 'trim' the mass of components to the value of the original. However, this is particularly logistically complex and restricts other degrees of design freedom.
- Although component dimensions are standardized depending on the type, differences have been observed. Many parameters such as length, width and height can be used on components. The scattering was significantly greater than for the mass, and the deviations of the mean values were within the scattering ranges. The geometry of components should be measured on random samples and not just on individual samples. The same test methods should be used by the manufacturer and for the verification query. This applies in particular to optical geometry measurements.
- The measurement of internal component dimensions is very universally applicable. X-rays are used to generate digital images that can be measured using standard methods of image evaluation. Many internal geometric features can be captured with an absolute accuracy of around one percent. Overall, we would like to recommend X-ray as a standard method of originality testing. 2D X-ray machines and software for image measurement are now very inexpensive. The process is non-destructive and can be automated. X-rays can therefore be regarded as a reference method.
Please refer to the original report [5] for information on the methods for identifying individuals that were comprehensively investigated in the project.
8 Acknowledgements
The IGF project 18683 N: ETRACE [5] of the Electrical Engineering Research Association of the ZVEI was funded by the Federal Ministry for Economic Affairs and Energy via the AiF as part of the program for the promotion of joint industrial promotion and development (IGF) on the basis of a resolution of the German Bundestag. The author would like to express his thanks for this funding and support.
Further thanks are due to the companies on the project committee for their support in supplying materials, producing test samples and working on the characterization of the components. The members of the project committee were Binder Elektronik GmbH, Eltroplan GmbH, Endress+Hauser GmbH & Co. KG, Hopp Elektronik GmbH & Co. KG, Merkur Elektronik GmbH, Neurocheck GmbH and Sick AG GmbH.
Bibliography
[1] German Electrical and Electronic Manufacturers' Association (ZVEI): Counterfeit components in electronics production: recommendations for action to reduce risk, November 2011
[2] Electronical Commission: Product piracy in electrical and electronic products: Methods and strategies in the fight against counterfeiting and piracy, http://www.vde.com/de/Institut/Kunden/Documents/ IEC_Counterfeiting_brochure_LR-en.pdf
[3] Pecht, M.; Tiku, S.: Bogus: electronic manufacturing and consumers confront a rising tide of counterfeit electronics, Spectrum, IEEE, vol. 43, no. 5, pp.37-46, May 2006, doi: 10.1109/MSPEC.2006.1628506
[4] Zweig, S.: Understanding the counterfeit components problem, http://www.glenbrooktech.com/blog/2011/10/understanding-the-counterfeit-components-problem/, accessed: 14.10.2014
[5] Wilde, J.: Final report on IGF project 18683 N, ETRACE, ZVEI 2020, download at https://www.fv-elektrotechnik.de/aktuelle-vorhaben
[6] Test Methods Standard, AS6171A, General requirements, suspect/counterfeit, electrical, electronic, and electromechanical parts, revised edition of 18. 04.2018, available for a fee at https://www.sae.org/standards/content/as6171a/
[7] Merli, D.; Sigl, G.: 'Physical unclonable functions', Springer, J. Datenschutz und Datensicherheit, Volume 36, Issue 12, pp 876-880, doi: 10.1007/s11623-012-0294-0
[8] Workman, J.; Springsteen, A.: Applied spectroscopy: a compact reference for practitioners. Academic Press, 1998
[9] Ganzoury, M.A.; Al am, N.K.; Nicolet, T.; Al, C.: Introduction to fourier transform infrared spectrometry, Renew. Sustain. Energy Rev., 2015
[10] Sales page for the Biorad spectral database: http://www.bio-rad.com/de-de/product/ir-spectral-databases?ID=N0ZXNZE8Z, call: 08.08.2019
[11] Sawyer, L. C.; Grubb, D. T.; Meyers, G. F.: Polymer microscopy, Third edition, 2008
[12] Alaee, M.; Arias, P.; Sjödin, A.; Bergman, Å.: An overview of commercially used brominated flame retardants, their applications, their use patterns in different countries/regions and possible modes of release, Environ. Int., vol. 29, no. 6, pp. 683-689, Sep. 2003
[13] Laachachi, A.; Cochez, M.; Ferriol, M.; Leroy, E.; Lopez Cuesta, J. M.; Oget, N.: Influence of Sb2O3 particles as filler on the thermal stability and flammability properties of poly(methyl methacrylate) (PMMA), Polym. Degrad. Stab., 2004
[14] Koltzenburg S.; Maskos, M.; Nuyken, O., et al: Polymers: Synthesis, Properties and Applications, Berlin Heidelberg: Springer Spektrum, 2014
[15] Czégény, Z.; Jakab, E.; Blazsó, M.; Bhaskar, T.; Sakata, Y.: Thermal decomposition of polymer mixtures of PVC, PET and ABS containing brominated flame retardant: Formation of chlorinated and brominated organic compounds, J. Anal. Appl. Pyrolysis, 2012
[16] N. N.: Description of the dimensions of the device type small outline transistor SOT223-4 on wikipedia, https://en.wikipedia.org/wiki/Small-outline_transistor#SOT223_(SOT223-4), accessed: 26.11.2019
[17] N. N.: Operating instructions for the NeuroCheck application software for industrial image processing, NeuroCheck GmbH, Remseck, Germany
[18] Parasuraman, S.D.; Wilde, J.: Training convolutional neural networks (CNN) for counterfeit IC detection by the use of simulated X-Ray images, Proc. EuroSime 2021, 22nd Int. Conf. on Thermal, Mechanical and Multi-Physics Simulation and Experiments in Microelectronics and Microsystems, 2021
