In 2017 and 2018, DIN 50957 "Testing of electroplating baths Electroplating test with the Hull cell" was routinely reviewed by the DIN committee NA 062-01-61 AA and the standard was divided into two parts.
Part 1 (DIN 50957-1:2016-02, Part 1: "Standard Hull cell") is based on DIN 50957-1978 and describes the standard Hull cell. Part 2 (DIN 50957-2:2019, Part 2: "Special test cells") includes an extended version of the Hull cell (long cell) compared to the standard cell as well as additional angled cathode plates. Using the geometries specified in the standards, 2D and 3D simulations of the primary and secondary current density distribution were carried out with the finite element programs COMSOL Multiphysics (electrochemical modul) and Cell Design.
In addition, the simulations were compared with experimental values.
1 Introduction
In DIN 20957-2 [1], which was developed in 2019, the dimensions of angle electrodes for electroplating were defined in addition to a long version of the Hull cell. In a first part [2], the long cell was described in addition to the standard Hull cell and COMSOL® simulations [3] were created for these using the finite element method (FEM) and current density distributions were compared with experimental results. The simulations were carried out in 2D, as no added value was to be expected from 3D simulations with significantly higher computational effort, and idealized conditions were assumed (electrodes are in contact with walls, simple electrode reactions).
Some additional considerations are presented here in order to extend the simulation models from 2D to 3D, which ultimately leads to the angled cathodes. These have a similar geometry and, in contrast to the standard Hull cell, deposition can be carried out under motion with forced convection. In addition, there are further differences: changes to the geometry in terms of angle and dimension, reduced length of the inclined flank, lack of insulating walls directly at the cathode for comparative moderation of the field distribution over the electrolyte depth.
As these changed (boundary) conditions require simulations in 3D, 2D simulations were first used to test the influence of a dimensional reduction, smaller electrodes and cells as well as segmented electrodes on the current density distribution. Furthermore, a multiple notch structure with further reduced cathode indentations was included.
The 3D simulations were started on the standard Hull cell, whose bottom plate and insulating boundaries were removed one by one, which finally leads to the simulation of the current density distribution of the angle electrodes. With regard to the model of the secondary current density distribution, the kinetic parameters specified in [2] were essentially reused (Table 1); in exceptional cases, the modified parameters are specified in each case.
2 Simulation of Hull cells with reduced and segmented electrodes and reduced cells
According to [1], the angled cathodes are free-standing and have slightly smaller dimensions compared to the standard Hull cell; the length of the angled area is a maximum of 25 mm. It therefore seems interesting to continue simulations of the Hull cell in this direction and to open up the geometry accordingly.
|
Parameters |
|||
|
Electrolyte conductivity |
κ |
0,1 |
S/cm |
|
Exchange current density |
j0 |
10-8 |
A/cm2 |
|
Cathodic table factor |
bK |
39,0 |
V-1 |
In Part 1 [2], Hull cells with electrodes perfectly flush with the side walls were simulated in 2D in accordance with the standard. This showed that the anode-cathode distance has no influence on the current density distribution due to the homogeneous field distribution up to the inclined wall, which contradicts the expectations of many practitioners. Therefore, simulations were carried out for the secondary current density distribution in which the width of the electrodes was reduced by dc (< 10 cm), whereby the basic geometry of the standard Hull cell (external dimensions, electrode height) remained unchanged, so that an insulating area (gap, dc/2) is created between the electrodes and the walls b and d at points 3 and 4 (see Fig. 1 in [2]). Furthermore, an increase in the anode-cathode distance was included, whereby the resulting lengthening of the Hull cell compared to the standard dimensions is indicated by dy.
 Simulierte Feldverteilungen von Standard- (dy=0 mm) und verlängerten Hull-Zellen (dy=52 mm und dy=102 mm) mit beidseitig um je 2,5 cm verkürzten Kathoden (dc=-50 mm) (I=0,5 A) und b) Vergleich der Stromdichteverteilungen der verlängerten Zellen mit verkürzten Elektroden (dc=-20 mm bzw. -50 mm und I=0,8 bzw. 0,5 A)) mit der Standard-Hull- Zelle (dc=0, I = 1 A)") Fig. 1: a) Simulated field distributions of standard (dy=0 mm) and extended Hull cells (dy=52 mm and dy=102 mm) with cathodes shortened by 2.5 cm on both sides (dc=-50 mm) (I=0.5 A) and b) comparison of the current density distributions of the extended cells with shortened electrodes (dc=-20 mm and -50 mm and I=0.8 or 0.5 A)) with the standard Hull cell (dc=0, I = 1 A)
Fig. 1: a) Simulated field distributions of standard (dy=0 mm) and extended Hull cells (dy=52 mm and dy=102 mm) with cathodes shortened by 2.5 cm on both sides (dc=-50 mm) (I=0.5 A) and b) comparison of the current density distributions of the extended cells with shortened electrodes (dc=-20 mm and -50 mm and I=0.8 or 0.5 A)) with the standard Hull cell (dc=0, I = 1 A)
2.1 Reduced electrodes
With smaller electrodes, both cathode and anode, the homogeneous (secondary) field distribution in the center of the cell is largely maintained, see Figure 1a. Again, it can be seen that the electric field fully utilizes the available space and that the insulating areas are also responsible for the field distribution. Although there is now a significant increase in the current density at the lateral electrode edges (dog-bone effect), the current density distributions in the central area on the side c of 4-7 cm (1.5-4.5 cm in relation to the reduced electrode) remain similar and approximate equation <2> from [2] (Fig. 1b). The cathode-anode distance thus primarily determines the required cell voltage, but does not contribute to a more uniform current density distribution.
2.2 Segmented cathodes
In contrast to the narrower electrodes shown in section 2.1, Kudryavtsev, Nachinov and coworkers [4] describe a segmented Hull cell with, for example, 10 individual electrode strips to determine the macroscattering capability. For this purpose, they used the ratio of the layer thicknesses or the mass increase of certain strips. In principle, the individual currents of the segments can be measured using appropriate measuring arrangements. Practical applications of segmented electrodes relate to classic rack electroplating or the auxiliary cathodes also used there. Segmented electrodes are also of interest outside of metal deposition in terms of current density distribution: for homogeneous redox systems, e.g. hexacyanoferrates [5] and gas-developing electrodes, for example.
, I = 0,91 A, a) Stromlinien im Elektrolyten, b) Stromdichten in Abhängigkeit von x im Vergleich mit der Standard- Hull-Zelle") Fig. 2: Secondary current density distributions of a segmented Hull cell (cathode: 10 segments of 9.1 mm each, 1 mm apart, reduced anode: 57.6 mm wide (adequate to the width of all cathode strips), I = 0.91 A, a) current lines in the electrolyte, b) current densities as a function of x in comparison with the standard Hull cell
Fig. 2: Secondary current density distributions of a segmented Hull cell (cathode: 10 segments of 9.1 mm each, 1 mm apart, reduced anode: 57.6 mm wide (adequate to the width of all cathode strips), I = 0.91 A, a) current lines in the electrolyte, b) current densities as a function of x in comparison with the standard Hull cell
Figure 2 shows the simulation results of such a segmentation into 10 segments, each 9.1 mm wide and 1 mm apart. As the cathode area is reduced by approx. 9 %, the anode and the applied current were also reduced accordingly for comparability.
Globally, the current lines show the same curve as in the non-segmented variant (Fig. 2a). However, the field curve at the segments is not resolved on this scale. The increase in current density at the edges of the individual segments is clearly visible, as is the decrease in current densities on the surface - especially in the high current density range (Fig. 2b). Apart from the increased current densities at the edges of the strips, the averaged curve follows the course of the unsegmented cell. In the low current density range below 1 A/dm2, there is a direct approximation to the curve of the secondary current density distribution and the edge elevations almost disappear.
 mit Schichtdickenmessungen des 10 mm breiten Mittelstreifens einer Dreistreifenanordnung, 1 mm Abstand zu 2 benachbarten Streifen; a) Randbereich und b) mittlerer Bereich") Fig. 3: Cross-sections (horizontal) with layer thickness measurements of the 10 mm wide center strip of a three-strip arrangement, 1 mm distance to 2 adjacent strips; a) edge area and b) center area
Fig. 3: Cross-sections (horizontal) with layer thickness measurements of the 10 mm wide center strip of a three-strip arrangement, 1 mm distance to 2 adjacent strips; a) edge area and b) center area
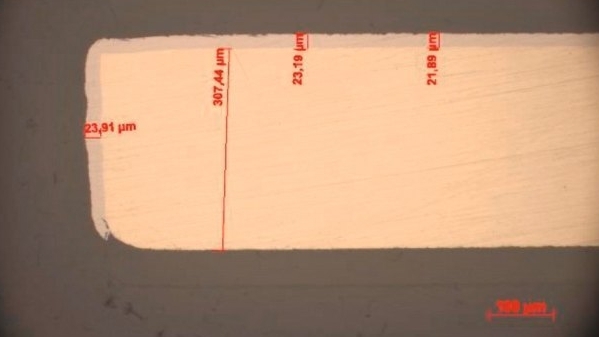
Similar increases in current density at edges were experimentally demonstrated with a three-strip arrangement [6]. Figure 3 shows layer thickness measurements at the edge (Fig. 3a) and in the middle (Fig. 3b) of a 10 mm wide nickel-coated strip from a three-strip arrangement, which was positioned at a distance of 1 mm from two neighboring strips. The difference in coating thickness between the center (approx. 20 µm) and the edge (approx. 23-24 µm) is up to 20 %, while the simulation predicts up to approx. 30 %.
2.3 Reduction of the standard Hull cell
In addition to the long cell used in particular for alkaline zinc deposition [1], smaller Hull cells are also used for special electrolytes. The Department of Electrochemistry and Electroplating uses the Tenori cell from the Yamamoto company [7] for electrolytes based on ionic liquids, in addition to cells built in-house. Table 2 shows the dimensions of this cell compared to the standard Hull cell. While the cathode length is reduced by half, the cathode area is reduced by a factor of 3. In contrast, the acute angle, which is important for the current density distribution, is only slightly smaller.
|
Dimensions / mm |
V / ml |
<) (cd) / ° |
|||||
|
a (anode) |
b |
c* (cathode) |
d |
h (filling level) |
|||
|
Tenori |
30 |
20 |
51 (50) |
60 |
30 |
36 |
36,9 |
|
DIN (standard) |
64 |
48 |
102 (100) |
127 |
44 |
250 |
39.0 |
As the simulation of the Tenori cell did not show any significant differences to the standard Hull cell, the standard Hull cell was reduced by a factor of 10 in each dimension in order to make a possible influence of the geometry more clearly recognizable. As the cathode area was reduced by a factor of 100, the current was also reduced from 1 A to 0.01 A in order to maintain the average current density jm and thus ensure comparability. Despite the reduction in cell size, the scale of the macroscattering capability is still maintained.
 Standard-Hull- Zelle (1 A) und b) der um 100 verkleinerten Zelle (10 mA), c) Stromdichte- Verlauf der Stan- dard-Hull-Zelle, Lang-Zelle sowie der jeweils verkleinerten Zellen") Fig. 4: Field distribution and current lines of a) the standard Hull cell (1 A) and b) the cell reduced by 100 (10 mA), c) current density curve of the standard Hull cell, long cell and the respective reduced cells.
Fig. 4: Field distribution and current lines of a) the standard Hull cell (1 A) and b) the cell reduced by 100 (10 mA), c) current density curve of the standard Hull cell, long cell and the respective reduced cells.
The diagrams of the potential distribution and the current lines(Fig. 4a and b, potential at the anode red, at the cathode blue) already show clear differences, which can be attributed to the shorter electrode spacing as a first approximation. However, the curvature of the current lines also shows that the current density distribution of the smaller cell is more uniform. If the current density is plotted against the relative length, this is confirmed by the flatter curve of the current density (Fig. 4c). The simulation shows a greater effect for the secondary current density distribution of the downsized long cell, especially in the range x/c > 0.5 there is no corresponding drop in current density as with the standardized long cell.
The conclusion is that with similar cells, the secondary current density distribution becomes somewhat more uniform with a large reduction in size and the differences in the current densities are not as significant.
3 Two-dimensional simulation of the secondary current density distribution of angled structures
 sowie skizzierte Hull-Zelle-Struktur") Fig. 5: Microform structure: original and pointed geometry (cell design) and sketched Hull cell structure In addition to the geometry of the Hull cell, similar trapezoidal structures occur in practice, which can be described with a two-dimensional simulation. On the one hand, the aim can be to achieve a layer thickness distribution that is as uniform as possible, but also to create wedge-shaped structures.
Fig. 5: Microform structure: original and pointed geometry (cell design) and sketched Hull cell structure In addition to the geometry of the Hull cell, similar trapezoidal structures occur in practice, which can be described with a two-dimensional simulation. On the one hand, the aim can be to achieve a layer thickness distribution that is as uniform as possible, but also to create wedge-shaped structures.
One such case is the trench or notch structures shown in Figure 5, which are much smaller than the standard Hull cell. The trapezoidal structure is also shown. The inclined flanks are approx. 8 to 10 mm, the notch depth approx. 6-9 mm and the cathode-anode distance a few cm, so that the scale of macro-scattering capability is still applicable here. In preparation for the angled cathodes, which can only be simulated in three dimensions, these notch structures were calculated in two dimensions using Cell Design [8]. The focus was on the rounded trench structure as shown in Figure 5.
The half angle here is 16.4°, and is slightly smaller compared to the long cell. The electrode length of the cathode is shortened from 78 to 65 mm from the pointed to the rounded shape. The electric field in front of the anode is homogeneous due to the laterally limiting walls as in the Hull cell. As described in chapter 2.3, the current density distribution is essentially analogous to the Hull cell.
3.1 Simulation of the primary and secondary current density distribution
The simulation was carried out for the case of the secondary current density distribution with slightly different parameters for a sulphamate nickel electrolyte (j0 = 10-8 A/cm2; α = 0.75 bK= 39 V-1; T = 50 °C; κ = 0.1 S/cm). A value of 0.45 A/dm2 was selected as the mean current density jm.
Figure 6a shows the course of the secondary current density across the width of the structure. It can be clearly seen that in the pointed structure there are higher current densities at the tips and lower ones in the notches (tooth) compared to the rounded structure, but in both cases there is a significant current density in the notches. The current density curve is the same at the 3 tips and 4 notches respectively. If one compares the current density distribution of the notch structure with that of the long cell (similar angle) with the same average current density, e.g. 1 A/dm2, the current densities in the microstructure are 2.4 to 0.4 A/dm2 and in the long cell > 5 to 0.02 A/dm2 (points 3 and 4 in Fig. 1 in [2]) in the tip larger and in the notch smaller. This is due to the fact that both the tips and the teeth are rounded accordingly. Accordingly, appropriate edge smoothing has long been recommended for the design phase of components [9].
 Sekundäre Stromdichteverteilung vs. Breite der Kathode b) Abhängigkeit der relativen sekundären Stromdichteverteilung j/jm vs. Elektrodenlänge (die Elektrodenlänge der 24 mm breiten Struktur beträgt ca. 64 mm)") Fig. 6: a) Secondary current density distribution vs. width of the cathode b) Dependence of the relative secondary current density distribution j/jm vs. electrode length (the electrode length of the 24 mm wide structure is approx. 64 mm)
Fig. 6: a) Secondary current density distribution vs. width of the cathode b) Dependence of the relative secondary current density distribution j/jm vs. electrode length (the electrode length of the 24 mm wide structure is approx. 64 mm)
 Potential-Verteilung d) Stromdichte-Verteilung über die Tiefe einer Kerbe (3D, von oben)") Fig. 6: c) Potential distribution d) Current density distribution over the depth of a notch (3D, from above)
Fig. 6: c) Potential distribution d) Current density distribution over the depth of a notch (3D, from above)
With the rounded trench structure, the primary current density distribution and the current density dependence of the secondary one were also calculated(Fig. 6b, current density vs. electrode length). The simulation of the primary current density distribution (dashed curve) shows that, in contrast to the simulation of the secondary current density, the current density in the notch drops to 0, i.e. in this case the peaks completely shield the depths.
The simulation of the secondary current density distribution shows that the equipotential lines enter the notch structure (Fig. 6c) and therefore the current density in the trenches does not decrease as much as in the primary field distribution. It is therefore also to be expected that a noticeable deposition and the desired tooth structure will form there. A constant current density results over the depth of the notch structure due to the lateral walls(Fig. 6d, calculated here in 3D).
In order to test which current density is most favorable for a sufficient layer thickness in the notch base, the average current density jm was varied in the simulation. Figure 6b shows the current density distribution for the different current densities. It can be clearly seen that the ratio of the current densities of the tip and the notch base becomes smaller and therefore more favorable as the current density jm decreases. It has already been pointed out in [2] that the current density-potential curve becomes flatter with lower current density and thus the polarization factor P increases. The course of the current density on the sloping edge can be approximated analogously to the standard Hull cell with equation <1
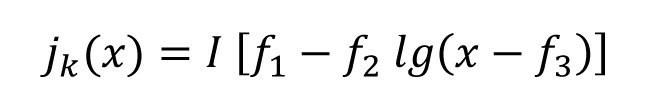 Eq. <1>
3.2 Experimental results - electroforming
 primäre Schichtdickenverteilung 6-mal je 50 h (jm=0,15 A/dm2) und b) sekundäre Schichtdickenverteilung 6-mal je 40 h 0,45 A/dm2") Fig. 7: Simulation microform structure; a) primary layer thickness distribution 6 times per 50 h (jm=0.15 A/dm2) and b) secondary layer thickness distribution 6 times per 40 h 0.45 A/dm2Incontrast to the previous simulations in chapter 3.1, larger layer thicknesses are deposited here, so that the initial geometry will change over time and thus also the current densities. Both Cell Design and COMSOL can be used to simulate the changes in geometry over time using the "moving boundary" method. In principle, the current density distribution is calculated iteratively from time t and from this the layer thickness distribution resulting at time t+Δt.
Fig. 7: Simulation microform structure; a) primary layer thickness distribution 6 times per 50 h (jm=0.15 A/dm2) and b) secondary layer thickness distribution 6 times per 40 h 0.45 A/dm2Incontrast to the previous simulations in chapter 3.1, larger layer thicknesses are deposited here, so that the initial geometry will change over time and thus also the current densities. Both Cell Design and COMSOL can be used to simulate the changes in geometry over time using the "moving boundary" method. In principle, the current density distribution is calculated iteratively from time t and from this the layer thickness distribution resulting at time t+Δt.
First, the primary layer thickness distribution was calculated, see Figure 7a. The same picture emerges as for the current density distribution, namely that the deposition is only concentrated on the peaks, resulting in the formation of cylindrical bulges ("heads"). The notches are shielded by the tips so that no filling occurs, which is the actual aim of the deposition. In addition, an uncontrolled growth of the nickel layer can also be seen in the simulation, which in practice manifests itself as the formation of large nodules. This is due to an incorrect formation of the surface structure during the successive simulation after a longer period of time.
The simulation of the secondary layer thickness distribution suggests a better result (Fig. 7b), as the current density in the trenches does not decrease as much compared to the simulation of the primary field distribution, so that a noticeable deposition also occurs there and the desired tooth structure is formed. However, it is apparently not possible to completely prevent the stronger layer thickness growth at the tips, so that the layer thicknesses always remain lower in the notch base. In principle, this can lead to the layers on the tips growing together and creating a cavity.
Figure 8 shows a nickel-plated notch structure provided by Kapp Niles, which was produced in a nickel sulphamate electrolyte. Figures 8a and b show the cross-section of this sample in its initial state and coated [10]. The shape of the deposition in the trenches agrees well with the secondary current density distribution obtained by simulation (Fig. 8b), whereby the coating thickness at the tip obtained in the experiment is approximately four times that in the notch. As soon as the rounding in the notch base has become an acute angle, the layers meet from both sides and the well-known effect of edge weakening can be observed, see Fig. 8c and d.
 Ausgangsstruktur, b) Querschliff") Fig. 8: Nickel deposition from sulphamate electrolytes: comparison between experiment and simulation a) initial structure, b) cross-section
Fig. 8: Nickel deposition from sulphamate electrolytes: comparison between experiment and simulation a) initial structure, b) cross-section
 Kerbe aus c), d) Simulation der Schichtdicken der Kerbe, Ausschnitt aus Abbildung 7b") Fig. 8: c) Notch from c), d) Simulation of the layer thicknesses of the notch, section from Figure 7b
Fig. 8: c) Notch from c), d) Simulation of the layer thicknesses of the notch, section from Figure 7b
The conclusion that can be drawn from these experimental results is that the simulation with the secondary current density distribution can already represent practice well.
If we look not only at the growth in layer thickness but also at the current densities at different times, we can see that the electrode length and area increase (Fig. 7) and thus the mean current density jm gradually decreases. Figure 9 shows the current density distribution after 40 h and 240 h, once over the constant width (Fig. 9a) and the other time over the effective electrode length (Fig. 9b). This clearly shows that the current density distribution becomes less uniform with increasing time as the geometry changes. In particular, the current density decreases at the notch base (tooth) and also at the slanted edges, while it increases at the tips and the edge.
 entlang der Strukturbreite (X-Koordinate) und b) entlang der (sich ändernden) Elektrodenlänge") Fig. 9: Current density distribution in the microstructure after different times: a) along the structure width (X-coordinate) and b) along the (changing) electrode length
Fig. 9: Current density distribution in the microstructure after different times: a) along the structure width (X-coordinate) and b) along the (changing) electrode length
3.3 Simulations to improve the layer thickness distribution
Since the experimental costs for electroforming in particular are very high, it is worthwhile using simulations that produce recommendations for practical application in much shorter times. To improve the layer thickness distribution, further simulations were carried out on the secondary current density distribution with lower current densities (see also Fig. 6b above for t = 0).
 0,2 A/dm2 480 h je 80 h und b) 0,1 A/dm2, 720 h je 120 h") Fig. 10: Variation of the current density to improve the layer thickness distribution a) 0.2 A/dm2 480 h per 80 h and b) 0.1 A/dm2, 720 h per 120 h
Fig. 10: Variation of the current density to improve the layer thickness distribution a) 0.2 A/dm2 480 h per 80 h and b) 0.1 A/dm2, 720 h per 120 h
Figure 10 shows the corresponding results, whereby the decrease in the applied current density from 0.45 (see Fig. 7b) via 0.2 to 0.1 A/dm2 leads to a significant improvement.
This goes so far that with a strong reduction in the average current density, almost the same current density can be achieved in the notches as on the tips. However, as this significantly increases the time required, a balance must be struck between the current density and the coating time and an individual optimum must be found that is based, for example, on the layer thickness to be achieved in the notch base. It is also possible to change the average current density over different deposition time intervals.
- to be continued -
Literature
[1] DIN50957-1 and -2
[2] Schmidt, U.; Peipmann, R.; Bund, A.: Galvanotechnik 112(3), 2021, 301
[3] COMSOL Multiphysics®, COMSOL AB, Tegnergatan 23, SE-111 40 Stockholm
[4] Kudryavtsev, N.T.; Kuznetsov, V.P.; Nachinov, G.N.; Pachushkina, L.A.: Zhurnal Prikladnoi Khimii 54(3), 1981, 580 and Nachinov, G.N. and Kudryavtsev, N. T.: Itogi Nauki Tekh., Ser. Elektrokhimiya, 15 (1979), 179
[5] Chmielowiec, B.; Cai, T.; Allanore, A.: Journal of The Electrochemical Society 163(5), 2016, E142-E146
[6] Strauß, T.; Sun, Y.; Schmidt, U.: Galvanotechnik 105 (2014) 264
[7] Company publication (catalog) from Yamamoto-MS Co., LTD, Tokyo, Japan
[8] CELL-DESIGN®, Software for Computer Aided Design and Simulation of Electrochemical Cells, L-Chem, Inc, 13909 Larchmere Blvd. Shaker Heights, OH 4412
[9] Electroplating-compatible design and manufacture of industrial components, ZVO brochure 97030, 2012
[10] Schorn, S.; Fritz, M.; Schmidt, U.; Bund, A.: Experiment und Simulation bei der Galvanoformung mit Nickel- Elektrolyten, Lecture ZVO-Tagung Garmisch-Partenkirchen 2016
[11] Salloum, B.; Gruia, V.; Schmidt, U.; Bund, A.: unpublished 2018
