In his presentation at the EIPC summer conference in Örebro (Sweden), Martyn Gaudion spoke about the effects of DC resistance on the measurement of the characteristic impedance of printed circuit boards. He has written up the presentation for PLUS.
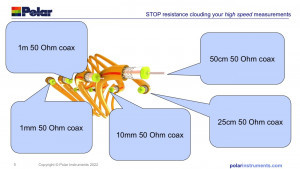 Fig. 1: Is the electrical resistance of all these cables always 50 ohms?it's great to be here again and meet everyone in person after what feels like such a long time. It's also very good to see so many material suppliers.
Trace structures are becoming more and more delicate, and your customers, the PCB manufacturers, sometimes start to question the dielectric constant measurements that you material suppliers take so carefully.
I'm going to show you a simple correction you can make to the measurements so that the measured dielectric constant is much more in line with the tested dielectric constant in the PCB industry.
What is an impedance controlled trace on a PCB? It's actually a simulation of a coax cable and I think you all agree that when you buy a coax cable from a supplier, let's say 50 ohms or 75 ohms or 100 ohms, it's always set to that value.
One question to ask yourself is this: Is the electrical resistance still 50 ohms for a one meter long cable, and is it still 50 ohms for a two meter or one millimeter long cable? Or does it then change(Fig. 1)?
So if I take a 50-ohm cable and cut it in half - is it then two 25-ohm cables? This is a trap that some PCB manufacturers fall into. I will show you below what the problem is.
So there are different cable lengths, but all have the same cable impedance. We simulate a coax cable on a PCB by designing it a certain way, and the idea that impedance changes with length has really only crept in because geometries have gotten finer and finer. In this situation, the DC resistance of the trace can distort the measurement.
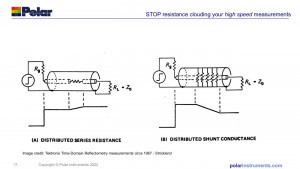 Fig. 2: Diagram from a TDR concept book by Tektronix (Image: James A. Strickland, Time-Domain Reflectometry Mesurements, Tektronix, 1969, p. 27)Some time ago, one of my colleagues asked Dr. Eric Bogatin [1] the following question: "Dr. Bogatin, which is correct - the simulation or the measurement?" Expecting to hear "the measurement" as the answer, Dr. Bogatin replied to my colleague's horror: "Well, I'm sorry - both are wrong". The simulation tells you what result you can predict in a perfect situation, and the measurement tells you what the measurement system sees. But the measurement can also be subject to error, and you have to first use your engineering intuition to figure out what the right answer is, and look at both the measurement and the simulation.
If you think about traces with wider geometries, the measurement of characteristic impedance was fairly straightforward as nothing in the measurement appeared to be 'falsified'. But as the geometries got finer and finer, we noticed that the DC resistance affected the measurements.
The geometries of fine wires have only recently been reduced to the point where DC resistance has become significant to the measurement industry. However, cable manufacturers were already aware of this in the 1950s and 1960s. The ohmic resistance in a cable is an important specification, but it must be distinguished from the characteristic impedance. Until recently, the geometries we worked with in the PCB industry allowed us to pretty much ignore DC resistance in high-speed traces. But today, the structures have become so fine that the DC resistance must be removed from the TDR readings [2] before the characteristic impedance is derived.
This diagram from a 1969 TDR concept book by Tektronix shows the effects of DC resistance in cables.(Fig. 2) It even suggests using the slope of the TDR curve to calculate how many 'ohms per meter' you see.
For example, let's look at two 50 ohm lines with a third 50 ohm line in the middle (circuit A) that has a DC resistance. You can see that the curve rises in the middle and then flattens out. But the line at the beginning and the line at the end are both identical. One is at the other end of a line with series resistance, so that the impedance appears to increase with length during the measurement.
The trap you can fall into is to believe that the impedance meter is always correct and that the impedance measurement is taken on the rising section, for example. However, in the case of fine lines, the DC resistance must be eliminated from the measurement.
 Fig. 3: Display in the Polar Instruments software
Signal integrity specialists use a technical term they call 'de-embedding', i.e. the series resistance must be corrected out of the measurement to obtain the correct characteristic impedance of the trace. If the series resistance were not removed from the impedance measurement, it could be concluded that the data sheet is incorrect because the simulation does not match the measurement. From this, one could conclude that the correlation is incorrect because the dielectric constant in the data sheet is incorrect. However, the real reason for the inaccuracy is that the real reason for the poor correlation was not recognized because the DC resistance component was not removed from the TDR measurements.
You can model the resistance and simulate the effect on a TDR trace. I used a very simple simulation to input the trace geometry of this differential pair. By modeling the copper width and thickness, we can see how much the rise on the TDR trace will be per millimeter due to the copper resistance. Then we can also remove this effect from the TDR measurement(Fig. 3 and 4).
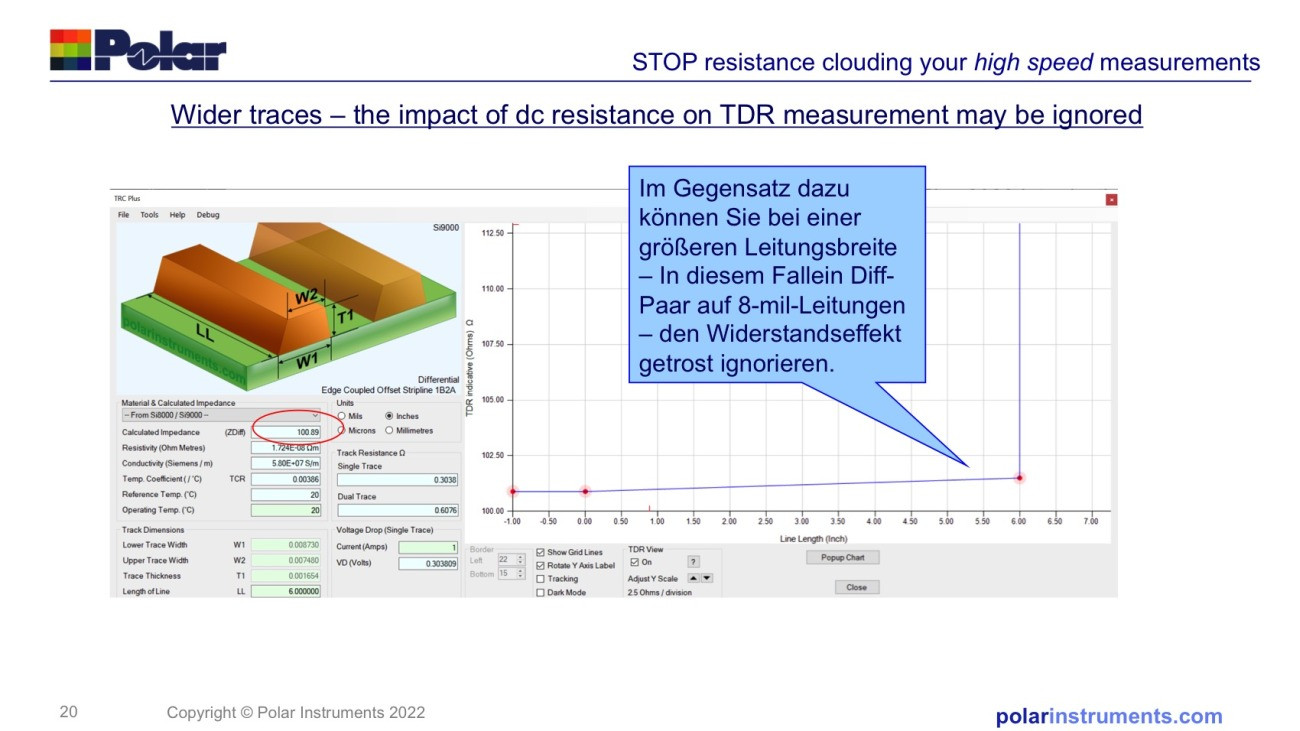 Fig. 4: Illustration in the Polar Instruments software
If you take the average measurement and double the length of the trace, it increases from a 100 ohm differential pair to a 105 ohm differential pair and to a 110 ohm differential pair, which is clearly a nonsensical measurement. But we observe that this happens again and again.
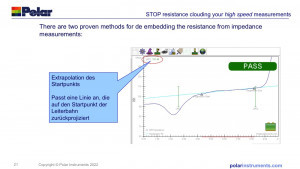 Fig. 5: Can the DC resistance be removed from the impedance measurement?This effect only affects the measurements when we go to 75 μm and below for the line widths with the thin copper substrates we use today. So I used the same model again, using thicker eight-mil (0.2mm) copper leads, and suddenly you have a nice, flat TDR trace with nothing to compensate for, so by creating a simple graph in Excel with a tool, you can see whether or not the DC resistance needs to be removed from the impedance measurement(Fig. 5).
There are two proven methods for removing DC resistance from the impedance measurement, and some OEMs prefer one over the other. The first is starting point extrapolation (LPE) - there has been much discussion about this at the IPC trade association. With LPE, a regression line is fitted to the TDR trace and projected back to the beginning of the section. You might ask: Why didn't you measure a very short section? Well, if the section is very short, the connection from the probe will interfere with the measurements. LPE is a technique that uses a nice, stable length of TDR measurement and projects back to the beginning of the section. This way I can get the average measurement of the section after removing the effect of the DC series resistance(Fig. 6).
Let's move on to the second method, which we have been using in our devices for about 28 years. Originally, we introduced this for a Japanese company that wanted to calculate the DC resistance per inch and add that number, then directly remove the predicted value in ohm/m from each section of trace. This alternative method is called 'DC resistance compensation'. Both methods work.
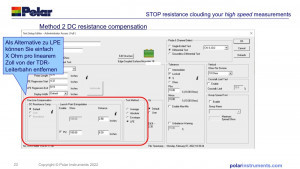 Fig. 6: With LPE, a regression line is fitted to the TDR trace and projected back If you find yourself in a conversation between a material supplier and a PCB manufacturer debating whether the dielectric value figures are really correct, then it is worth asking whether they are compensating for DC resistance on PCBs with very fine structures.
You have to look at both the measurement and the modeling and use your technical intuition. The measurement is not always correct and the model is not always correct. You have to have a good model and a good measurement - and take into account effects that you may not have had to consider in the past.
Even if you don't have access to polar tools, you can just use Ohm's law U = R * I and the conductivity of the electrodeposited copper to estimate this for yourself.
Thank you very much, it was a pleasure to speak in front of you again.-dir/rom-
www.polarinstruments.eu, www.tek.com
References
Dr. Eric Bogatin, Associate Professor of Electrical, Computer and Energy Engineering at the University of Colorado Boulder
Time-domain reflectometry
Sources
James A. Strickland, Time-Domain Reflectometry Mesurements, Tektronix, 1969


