4.5 Evaluation of the use of a combined heat and power unit (CHP) to replace reactive power generation and for heating supply
As described above, the use of a combined heat and power unit (CHP) to heat the pools is considered below. The CHP unit is designed to keep the temperature of the baths constant, to replace the reactive power supply and for the proportionate heating supply (static and dynamic heat consumers) in the new production hall.
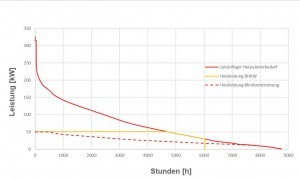
 Fig. 20: Ordered annual duration curve of the future heating energy requirementForenvironmental and cost reasons, the temperature stabilization should not be electrical.
Figure 20 shows the future heating energy requirement, taking into account the above heat consumers and the proportionate thermal output of a CHP unit.
It can be seen that the CHP unit's share of reactive power generation is approx. 85 percent.
The remaining energy requirement for reactive power generation of approx. 15 percent is provided by a boiler.
In terms of the heating requirement, approx. 48 percent of the heating requirement is covered by the CHP unit and 52 percent by a boiler.
Table 18 shows the expected future heating energy demand for the boiler and the CHP unit.
|
Designation |
Unit |
Value |
||
|
Heating energy |
Boiler |
CHP |
Total |
|
|
Heating capacity |
kW |
275 |
51 |
326 |
|
Annual heating energy |
kWh/a |
314 361 |
296 565 |
610 926 |
|
Full load hours |
h/a |
1145 |
5815 |
1874 |
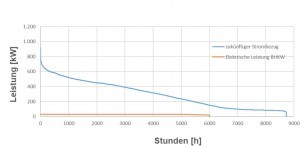
 Fig. 21: Ordered annual duration curve of future electricity demandFig . 21 shows the future electricity demand, taking into account the previously assessed electricity consumers and the electrical output of a CHP unit. Figure 21 also shows that 100 percent of the electricity generated by the CHP unit can be integrated into the production process.
A significantly larger design of the CHP unit does not make sense due to the coupled heat generation as shown in Figure 20.
In terms of electricity demand, approx. 7 percent of future electricity demand will be covered by the CHP unit and 93 percent of future electricity demand will be covered by the public power grid.
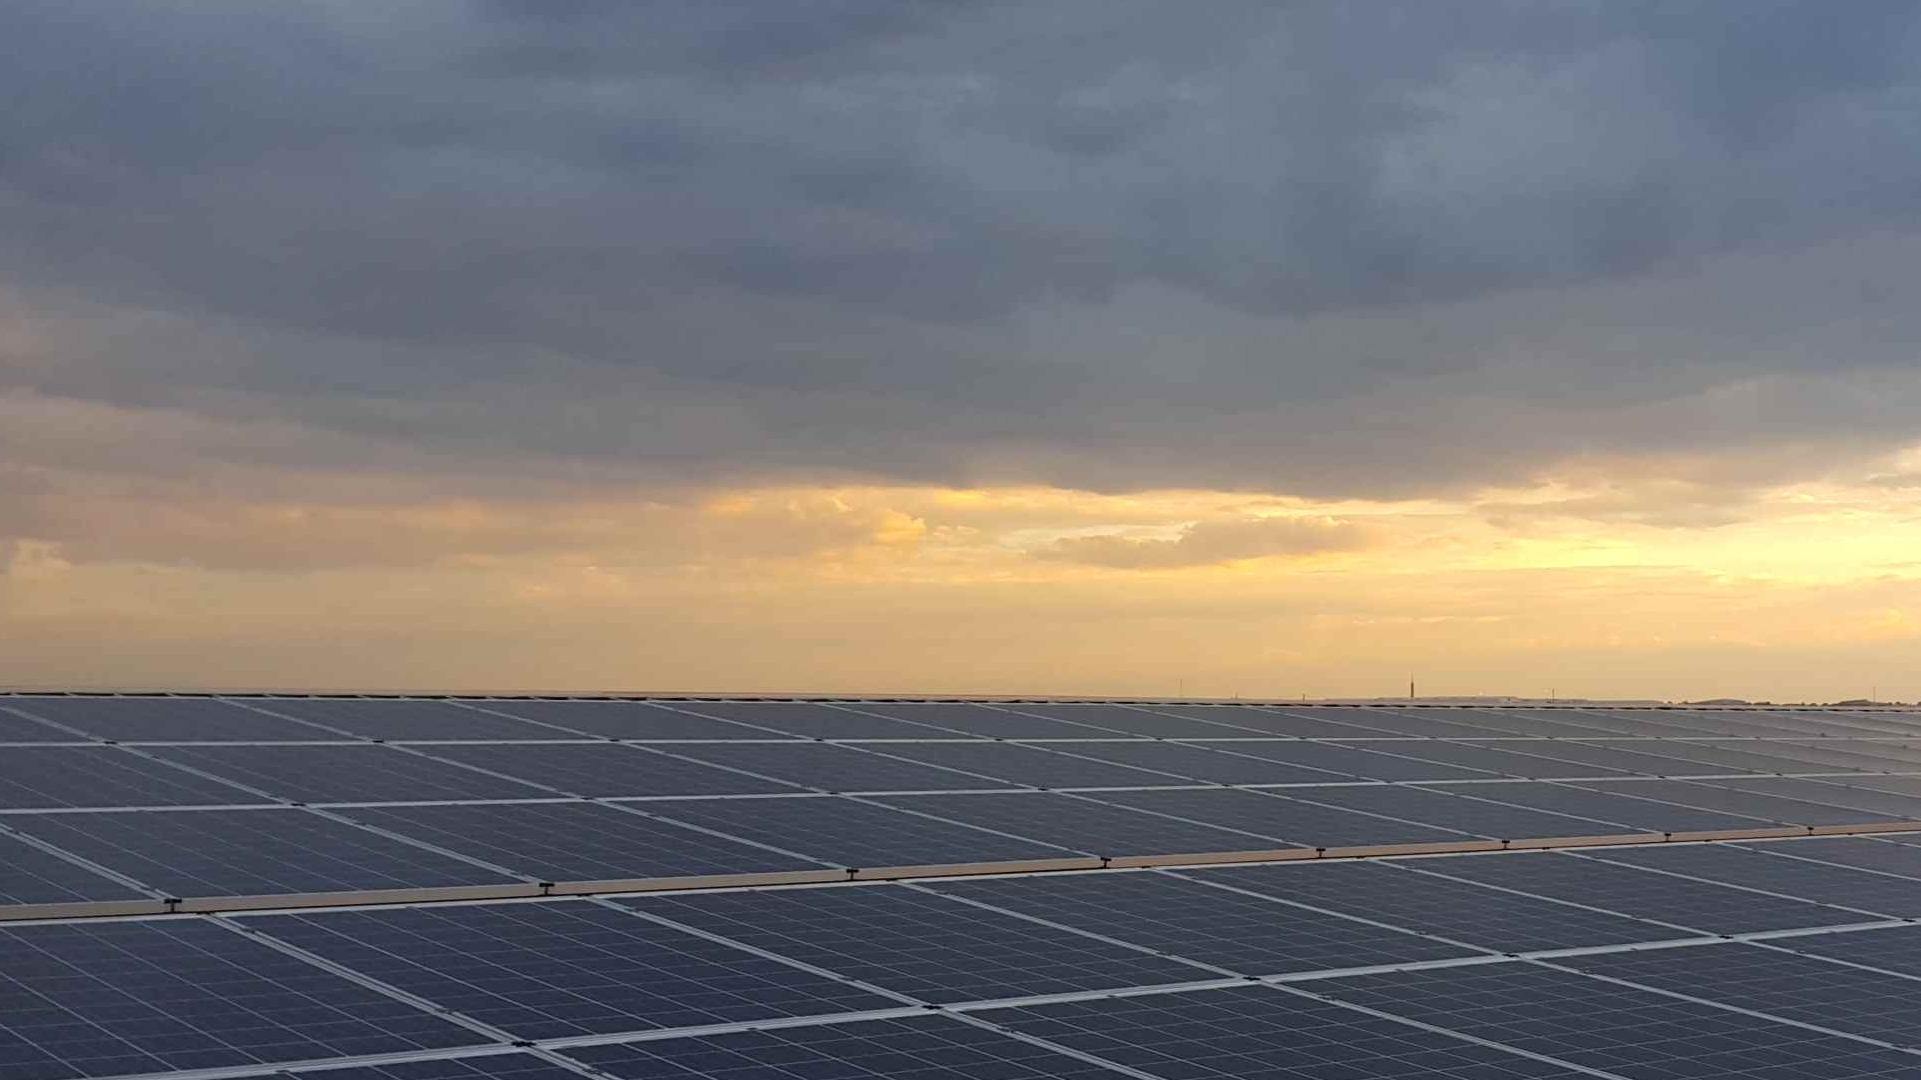
In addition, the remaining electricity consumption could be significantly reduced by installing a photovoltaic system.
However, more concrete statements on this can only be made at a later date when the building plans for the new production hall are available.
Table 19 shows the expected future residual electricity consumption and the proportion of CHP operation.
|
Designation |
Unit |
Value |
||
|
Electricity |
Residual electricity consumption |
CHP |
Total |
|
|
Active power |
kW |
948 |
30 |
978 |
|
Residual power consumption |
kWh/a |
2 414 639 |
174 458 |
2 589 096 |
|
Full load hours |
h/a |
2548 |
5815 |
2648 |
According to an initial rough cost estimate, the static capital payback period is approx. 7.5 years. This does not include costs for adaptation measures such as the replacement of the tube heat exchangers or proportionate piping etc.
5 Assessment of the expected future primary energy consumption and itsCO2 emissions
The expected primary energy consumption for the electroplating company resulting from the implementation of the measures described above is assessed below.
For this purpose, theCO2 emissions in the current state are compared with those that are to be expected in the future.
In order to obtain the primary energy input of natural gas, the heating energy requirement of the boiler is evaluated according to Table 18 with an annual system efficiency of ή = 85 percent and that for the CHP unit with an annual thermal system efficiency of ή = 52 percent.
The future primary energy input for electricity is taken from Table 19.
Table 20 below shows the future primary energy input for natural gas and electricity.
|
Designation |
Unit |
Value |
|
|
Electricity |
Natural gas |
||
|
Power output |
kW |
978 |
422 |
|
Annual energy |
kWh/a |
2 589 096 |
940 154 |
|
Full load hours |
h/a |
2648 |
2233 |
With the future primary energy input shown in Table 20, the futureCO2 emissions are listed in Table 21. The previously stated emission factors are used in the assessment.
|
Designation |
Unit |
Value |
||
|
Electricity |
Natural gas |
Total |
||
|
CO2 emissions |
to/a |
1598 |
233 |
1831 |
|
CO2 emissions |
% |
87 |
13 |
100 |
Table 22 shows the savings in primary energy andCO2 emissions.
|
Designation |
Unit |
Value |
||
|
Electricity |
Natural gas |
Total |
||
|
Primary energy savings |
kWh/a |
912 609 |
659 496 |
1 572 105 |
|
Savings inCO2 emissions |
to/a |
563 |
165 |
729 |
|
Savings in primary energy andCO2 emissions |
% |
26 |
42 |
44 |
Table 22 shows thatCO2 emissions from the primary energy source electricity were reduced by 26%, those from the primary energy source natural gas by 40% and by 44% overall.
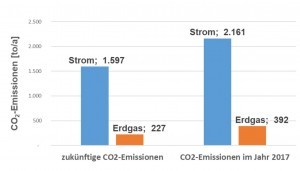
Figure 22 compares theCO2 emissions from 2017 with those expected in the future.
6 Profitability analysis and subsidies
 Fig. 22: ComparisonofCO2 emissionsInthis article, we have not gone into an in-depth profitability analysis. However, in the chapter describing the measures for energy and cost savings, the static capital payback period for each measure was given as an indication. In this respect, a qualitative entrepreneurial assessment can be made.
The costs for primary energy purchases of electricity and natural gas are reduced by a total of 44 percent. For the electroplating company evaluated here, this means an annual cost saving of approx. 175,000 euros (net).
In order to achieve the environmental policy goals, funding programs have been set up for energy consulting and for investment measures in production facilities and processes, for example by the Federal Office of Economics and Export Control (BAFA) and the Kreditanstalt für Wiederaufbau (KfW). Some of these are listed below, although no claim is made to completeness:
- "Energy consulting for SMEs" funding program, BAFA
- Federal funding for "Energy efficiency in industry", Module 1, "Cross-sectional technologies", Module 2: "Process heat from renewable energies", Module 3: "I&C, sensor technology and energy management software" and Module 4: "Energy-related optimization of systems and processes", whereby Module 4 is identical to the following funding programme; BAFA is responsible for this
- Funding program "Energy efficiency program - production plants/processes", KfW
In individual cases, it must be clarified which funding program combination is optimal.
Conclusion
In summary, it can be said that
- Significantly increasing energy efficiency and implementing the appropriate technical measures will be necessary in the future in order to reduceCO2 emissions and primary energy costs in electroplating companies. For electroplating companies, this means evaluating and implementing the appropriate measures.
- It should be clear that achieving the climate protection targets is only possible if allCO2 emission reduction potentials are exploited.
- Funding programs can be used to reduce the financial burden on the electroplating company.
- In the future, it will be of central importance to significantly reduce the proportion of residual electricity consumption through the use of renewable energies (e.g. photovoltaics). Intelligent storage and energy management systems have a special role to play here.
Literature
[1] TU Berlin, continuing education course in energy consulting, energy management, Prof. Dr. Dietmar Winje, 1995
[2] Bavarian State Office for Environmental Protection, Augsburg, Efficient energy use in the electroplating industry, 2003
[3] International Institute for Sustainability Analysis and Strategies, GEMIS Emission Factors for Greenhouse Gases, 2017
[4] Fachverband Oberflächentechnik e. V., Hilden, Guideline for the design of exhaust air systems, 2003


