Capacitive pressure sensors are integrated in many different systems and environments. Fill level monitoring in washing machines and fuel tanks at filling stations as well as pressure monitoring in biomedical devices are exemplary applications. In the following article, the use of electroformed spring materials for the fast and cost-effective production of pressure sensor membranes was investigated. It was shown that electroformed CuSn alloys with approx. 9-11% tin by weight are suitable for this purpose up to certain application limits. The electroplating production process on a laboratory scale and the mechanical properties of the CuSn alloys were investigated as part of the IGF project 19905N 'SkalaD', between the Research Institute for Precious Metals + Metal Chemistry and Hahn-Schickard.
1 Introduction to the SkalaD project
Applications for pressure measurement technology are ubiquitous and characterized by a very wide range of requirements in terms of the pressures and media to be measured as well as the ambient conditions. In order to be successful with a measuring principle in as many fields of application as possible, the scalability of a sensor is a basic requirement. In addition, the flexible adaptability of the sensor cell to a wide variety of set-up and measurement environments is important.
The present work was carried out as part of the IGF project 19905N "Scalable low-cost pressure sensor with galvanically produced sensor membrane and high-pressure-resistant joining technology" (SkalaD) between the Research Institute for Precious Metals and Metal Chemistry (fem) in Schwäbisch Gmünd and Hahn-Schickard. This article focuses on the fem's project-related work. The aim was to produce membranes for pressure sensors from a copper/tin alloy using electroforming. Up to now, Hahn-Schickard has used pressure sensor diaphragms that are produced by deep drawing from rolled foils made of e.g. stainless steel or tin bronze (CuSn8). Electroforming is an alternative for the cost-effective production of sample components or small batches as, in contrast to deep drawing, no expensive stamping tools are required.
Materials with pronounced elastic properties are suitable for use as pressure sensor diaphragms in order to avoid drift or hysteresis of the sensor signal under cyclical pressure loads (spring materials). In order to achieve these properties in CuSn alloys, alloy compositions with 9-11% tin by weight are sought. The commercially available electrolyte Miralloy 3849® from Umicore Galvanotechnik GmbH was used for this purpose in the project [1]. In principle, it is suitable for electroforming. The desired alloy composition in the range of 9-11 wt.% tin is possible through a suitable choice of deposition and process parameters. The article will focus on the determination of the alloy composition, the mechanical properties by means of tensile tests, the hardness, the relaxation behavior and the determination of the metallic phases as well as the investigation of possible phase transitions after heat treatment of foils with a tin content of 8 and 15 percent by weight.
1.1 Experimental work
The electrolyte Miralloy 3849® was used for the deposition experiments. This is an alkaline/cyanide CuSn alloy electrolyte. The low electrolyte volumes used in the research work favor the occurrence of electrolyte depletion of metal ions or additives. For this reason, bath controls were carried out at short intervals. Self-supporting CuSn foils were produced to determine the mechanical properties. Aluminum substrates were used for this purpose, with the edges and backside covered with Slotowax (Dr.-Ing. Max Schlötter GmbH & Co. KG). To activate the aluminum surface, the stripped substrates were treated with the first 4 steps of the Al Bond III zincate stain from International Plating Technologies GmbH. Subsequently, 4 µm thick Cu starter layers were applied to the sheets with a cyanide Cu electrolyte (Cu 830® from Umicore) at 58 °C, a current density of 2 A/dm2 and a deposition rate of ~0.8 µm/min [2]. The substrates coated with the Cu starter layer were immersed in the Miralloy 3849® electrolyte under current. The deposition was carried out at 55 °C with a current density of 3 A/dm2 using insoluble mixed metal anodes. The deposition rate was approximately 0.6 µm/min [1]. The coated aluminum sheets were then rinsed and immersed in NaOH for chemical removal of the aluminum carrier.
X-ray fluorescence analysis (XRF) (Fischerscope X-Ray XDYM) was used to non-destructively determine the copper and tin content of the electrodeposited foils. In addition, the metal content was determined using optical emission spectroscopy with inductively coupled plasma (ICP-OES). An ICP-OES ICAP 6300 DUO from Thermo Fischer was used for this purpose. Depth profiles of the various alloying elements were created using glow discharge spectroscopy (GDOES) with a GDA 750 from Spectruma. The scanning electron microscope (SEM) images and the energy dispersive X-ray spectroscopy (EDX) measurements were carried out on a Gemini 300 from Carl Zeiss AG. Tensile tests were carried out on a Z100 from Zwick/Roell, strain-controlled at 0.1 %Lo/s. Hardness measurements were carried out both by grinding (AMH55 from Leco) and by means of instrumented indentation testing (Fischer H100 xy p from Helmut Fischer GmbH) on the surface. The XRD (X-ray diffraction) diffractograms were then recorded on a D8 Discover Da Vinci from Bruker AXS using Cu Kα 40 kV/40 mA radiation at room temperature and after annealing tests at corresponding annealing temperatures. The measurements were carried out in Bragg-Brentano geometry with a Lynxeye XE-T 1D detector. The measuring range was between 10° and 110° with a step size of 0.02° and a counting time of 1 s. The qualitative phase inventory was determined by comparing the reflexes with the ICDD-PDF-2 database in the Diffrac.Eva 4.3 software from Bruker AXS.
2 Determination of the alloy composition
The alloy composition was determined as part of the project using four different methods: XRF, ICP-OES analysis, GDOES and EDX analysis in the scanning electron microscope. With the help of XRF, layer thicknesses and alloy compositions can be determined non-destructively. However, calibration samples of known content must be measured as XRF. These calibration standards were produced using ICP as part of the project [3]. Table 1 shows that the required alloy compositions of 9-11 wt.% tin were detected with ICP and XRF.
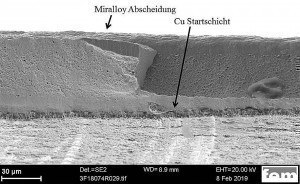
The traces of aluminum in the case of the ICP measurement are due to the aluminum substrate used. No aluminum is incorporated into the coating. However, ICP-OES or XRF cannot be used to determine element profiles and therefore no statements can be made about the depth profile. Further analytical methods must be used for comprehensive material characterization. In order to be able to make statements about the depth profile of the various alloy elements, the layer thickness profile was determined using EDX and GDOES [4, 5]. The GDOES depth profile in Figure 1 shows minimal fluctuations in the composition of the film.
These irregularities can be explained by electrolyte depletion. For this reason, metal ions and additives were added during longer deposition times, resulting in a change in the alloy composition from the time of addition. This material difference can also be seen in the contrast of the SEM image in Figure 2 and in the line scan curve.
|
ICP |
XRF |
||
|
Metals |
Weight % |
Metals |
Weight % |
|
Cu |
90,596 |
Cu |
89,82 |
|
Sn |
9,4 |
Sn |
10,18 |
|
Al |
0,004 |
- |
- |
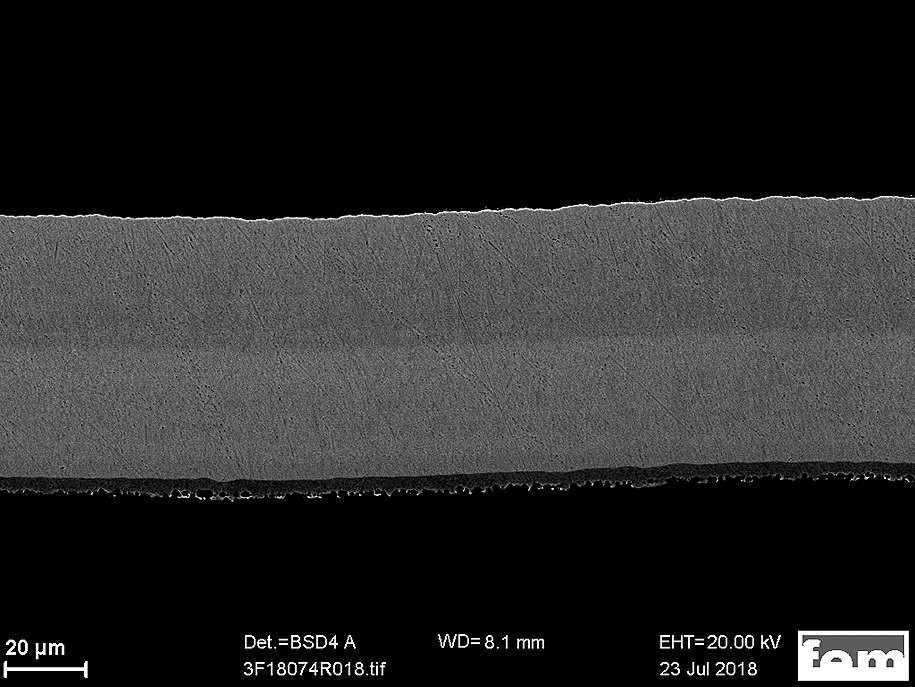 Fig. 2: SEM image during an EDX line scan measurement
3 Determination of the mechanical properties
In addition to the alloy composition, the mechanical properties of the electroplated CuSn alloys are important. They set the limits for future application as pressure sensor membranes. For the tensile and relaxation tests, deposited CuSn foils were cut to size using a laser. (see Fig. 3).
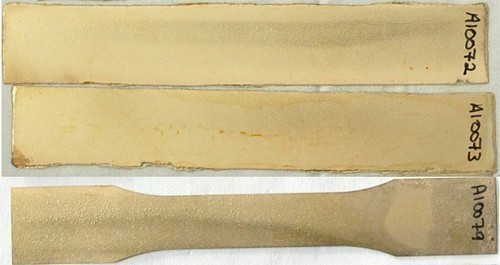 Fig. 3: Electroplated CuSn foils for the determination of mechanical properties. The specimens for tensile and relaxation tests were cut to size using a laser
3.1 Tensile tests
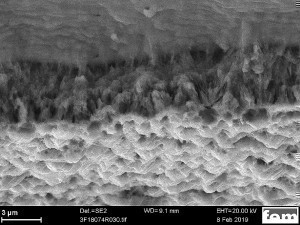
Foils with alloy compositions of 9.2 to 14.9 wt.% tin were investigated using strain-controlled tensile tests at 0.1 %Lo/s. The Young's modulus (mE) [GPa], the yield strength (Rp 0.2) [MPa], the tensile strength (Rm) [MPa], the uniform elongation (Ag) [%], the breaking strength (RB) [MPa] and the elongation at break (A) [%] were determined from the graph of the standard force (MPa) vs. elongation (%Lo). Following the tensile tests, the samples were examined under an optical microscope and in some cases with an SEM. This allowed the fracture characteristics to be assessed in more detail. Both the images from the scanning electron microscope and the tensile test curves reveal a ductile fracture characteristic (see Fig. 4 and Fig. 5).
Table 2 summarizes the results of the mechanical properties, hardness measurements and tensile tests in comparison with values from a material database (rolled samples). Of particular interest here is the target composition with a tin content of 10 wt.% (comparison between electroplated CuSn and cast sample, green and blue lines in Table 2). The electroplated alloy has the lower modulus of elasticity. The yield strength and tensile strength values are in the range of the average value of the rolled material. In terms of elongation at break, the electroplated foil is at the lower value of the elongation at break range of the heat-treated rolled foils. The hardness of the Miralloy foil, on the other hand, is higher than that of the CuSn cast samples.
|
Sn content |
E Modulus |
Yield strength |
Tensile strength |
Uniform elongation |
Breaking strength |
Elongation at break |
Hardness |
|
|
wt % |
mE GPa |
Rp0.2 MPa |
Rm MPa |
Ag % |
RB MPa |
A % |
HV |
|
|
Average values of tensile tests and hardness measurements |
9,2 |
92,8 |
589,8 |
748,8 |
3 |
718,4 |
4,72 |
240 |
|
10,0 |
89,18 |
573,8 |
730,8 |
3,2 |
688 |
5,8 |
254 |
|
|
11,6 |
85,28 |
576,2 |
740,8 |
3,74 |
734,8 |
5,34 |
||
|
12,2 |
85,47 |
595,33 |
768,00 |
3,17 |
756,67 |
5,1 |
||
|
13,3 |
84,3 |
619,25 |
797 |
1,475 |
790,5 |
1,525 |
||
|
14,9 |
83,8 |
685,5 |
842 |
1,3 |
841 |
1,3 |
||
|
Instrumented penetrant testing |
9,06 |
90.39 |
- |
- |
- |
- |
- |
235 |
|
9,63 |
82.25 |
- |
- |
- |
- |
- |
244.7 |
|
|
10,04 |
79 |
- |
- |
- |
- |
- |
230.6 |
|
|
CuSn8 (sheet metal) |
8 |
109 |
360-710 |
370-750 |
- |
- |
3-20 |
90-240 |
|
CuSn10 (cast iron) |
10 |
110 |
200-780 |
400-830 |
- |
- |
2-55 |
70-85 (70-80 Brinell) |
|
CuBe2 |
2 % Be |
125 |
190-380 |
410-540 |
- |
- |
35-60 |
125 (125 Brinell) |
3.2 Hardness measurements
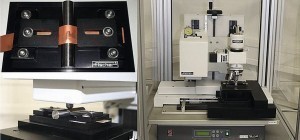
The hardness of the Miralloy bronze deposits was determined using two different measuring methods. Hardness measurements were carried out on the cross-section and by means of an instrumented indentation test. The measuring setup was equipped with a new measuring adapter for foils (see Fig. 6) and the measurement is carried out on the surface. The hardness is not only determined by the indentation geometry, but the force and indentation depth are also recorded during the measurement. This means that an elastic indentation modulus of the films can also be determined [10]. The hardness values of the cross-section measurements and the instrumented indentation test as well as the modulus of elasticity determined from the tensile tests and the instrumented indentation test show consistent results regardless of the measurement method. The hardness value of the deposited Miralloy bronze with ~10 wt.% tin is around 245 HV. The values of electroplated samples are always higher than those of CuSn castings or sheet metal samples. The reason for this is that the corresponding cast and sheet materials are often heat-treated. This post-processing step influences both the mechanical properties of the sample and the hardness values.
3.3 Relaxation
For the possible application of galvanoformed films as pressure sensor membranes, it is crucial whether or not relaxation occurs in certain load/temperature ranges. Relaxation is defined as a drop in force or mechanical stress occurring at a constant elongation [11]. This process is temperature-dependent and can lead to a drift or hysteresis of the sensor signal when pressure is applied.
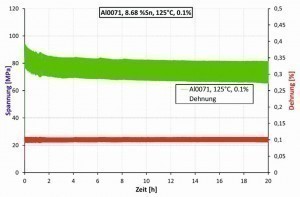
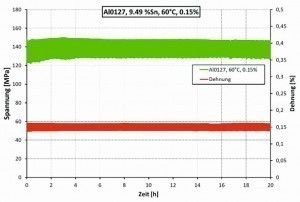
The relaxation behavior of the CuSn foils produced as part of the project was determined at Hahn-Schickard using a TiraTest 2810 tensile testing machine in a climate-controlled test chamber and recorded over several hours. The climate chamber is heated to test temperature and then kept at this temperature. Within a few seconds, a constant strain is applied to the sample and the force/mechanical stress is measured. Figure 7 shows an example of a measured relaxation curve of an electroplated Miralloy film.
As can be seen, the sample shows clear relaxation behavior at a temperature of 125 °C and an elongation of 0.1 % (see Fig. 7). At a temperature of 60 °C and an elongation of 0.15 %, however, no relaxation behavior was observed (see Fig. 8).
From a series of measurements carried out, corresponding application limits could be determined, which are shown in Table 3 . Below the specified temperature and load limits, electroplated CuSn foils can be used as pressure sensor membranes without relaxation occurring.
|
Determined application limits CuSn foil with ~9.2 wt.% Sn |
||
|
Temperature [°C] |
Elongation [%] |
Elongation [mm/mm] |
|
60 |
0,15 |
0,0015 |
|
85 |
0,07 |
0,0007 |
|
100 |
0,05 |
0,0005 |
4 XRD results
Metallic phases with crystalline or ordered structures can be determined using X-ray diffraction (XRD). The phase diagrams in Figures 9 and 10 show at different temperatures/alloy compositions where phase changes/phase fraction changes are possible in CuSn alloys with a weight fraction of 10 wt.% tin. The equilibrium phase diagram in Figure 9 of the CuSn system shows the possible phases Cu(Sn), Cu(Sn) + ε and Cu(Sn)+δ in the range of alloys with a tin content of 10 wt.%. Figure 10 shows the possible phases of electrochemically produced CuSn alloy films. With a tin content of 10 wt.% in the alloy, the following phases can be formed: Cu(Sn), Cu(Sn)+T(I), Cu(Sn)+β' and Cu(Sn)+Or. Pressure sensors are often used in areas with elevated temperatures. This can lead to phase changes under operating conditions, which can affect the mechanical properties and therefore the pressure measurement signal. Electrochemically produced CuSn-10 alloys that have not been heat-treated form a copper (tin) solid solution phase. To assess possible phase transitions, the diffractograms of electroplated CuSn foils were examined before and after heat treatment.
![Abb. 10: Phasendiagramm elektrochemisch hergestellter Cu/Sn-Legierungen [13] Abb. 10: Phasendiagramm elektrochemisch hergestellter Cu/Sn-Legierungen [13]](/images/stories/Abo-2021-04/thumbnails/thumb_gt-2021-04-0062.jpg) Fig. 10: Phase diagram of electrochemically produced Cu/Sn alloys [13]
Fig. 10: Phase diagram of electrochemically produced Cu/Sn alloys [13]
4.1 Heat treatments
To assess possible phase transitions, heat treatments were carried out on electroplated CuSn alloy foils with approx. 10 wt.% tin. It was investigated whether and when the metallurgical alloy phases ε, δ or the galvanic CuSn alloy phases T(I), β' or Or are formed. For the annealing process, the temperature was gradually increased in-situ up to 320 °C. The annealing profile is shown in Table 4 . The phase inventory was determined after each annealing step. During the annealing process in an air atmosphere, copper and tin oxide layers were formed. For this reason, longer annealing tests of 9 days were carried out under vacuum. Both in an air atmosphere and in a vacuum, the diffractograms show a reduction in the half-width of the reflections of the copper/tin solid solution phase due to the annealing process (Fig. 11 and Fig. 12) . This can be interpreted as the healing of defects or grain growth. After the annealing process in an air atmosphere, copper oxide and a small amount of nanocrystalline tin oxide are present as further phases. Copper oxide can be recognized by the reflections at approx. 35.5° and 38.5° 2Θ. Tin oxide can be recognized by the broad reflex at approx. 37.5° and 52° 2Θ. The formation of an intermetallic phase could not be detected under this annealing profile. Even after 9 days at 320 °C in the vacuum furnace, no formation of an intermetallic phase was detectable.
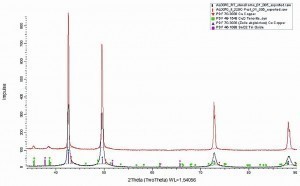 Fig. 11: Section of the XRD diffractogram of an electroplated CuSn foil with 10 wt.% tin before and after the in-situ annealing process. The reflections of the CuSn solid solution, of pure Cu, of CuO and SnO2 from the ICDD-PDF-2 database were inserted for a comparison of the reflections and a determination of the qualitative phase composition with the software Diffrac_Eva 4.3 from Bruker AXS
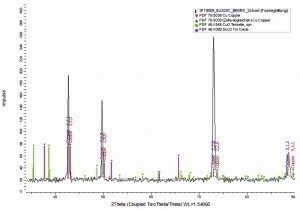 Fig. 12: Section of the XRD diffractogram of an electroplated CuSn foil with 10 wt.% tin before and after the annealing process of 9 days in a vacuum furnace at 320 °C. The reflections of the CuSn solid solution, of pure Cu, of CuO and SnO2 from the ICDD-PDF-2 database were inserted for a comparison of the reflections and a determination of the qualitative phase composition with the software Diffrac_Eva 4.3 from Bruker AXS
|
Stepwise annealing - temperature profile |
|
|
Temperature (°C) |
Time of measurement (hours) |
|
25 |
0 (measurement with and without dome) |
|
200 |
1 |
|
320 |
1,5 |
|
320 |
2 |
|
320 |
2,5 |
The XRD analysis after the annealing process of 9 days cannot exclude all phase changes of the Cu/Sn system at higher temperatures or even longer times. After 9 days at 320 °C, however, no change in the phase structure can be detected.
5 Summary
Pressure sensor diaphragms require pronounced elastic material properties in order to provide drift and hysteresis-free measurement signals. Electroplated materials can fulfill these criteria under certain operating conditions. Cu/Sn alloys with a tin content of 9-11 wt.% were identified as promising candidates. As part of the project, it was possible to deposit this alloy composition as free-standing foils and to confirm the composition integrally and in the depth profile. Using hardness measurements, a hardness of approx. 245 HV was determined for samples with 10 wt.% tin. The tensile tests showed comparable results to metallurgically produced cast and sheet materials. Application limits (combination of temperature and corresponding elongation) were determined on the basis of tensile and relaxation tests. These limits define a range of application in which the spring materials galvanically produced from a CuSn alloy with ~10 wt.% tin showed no loss of tension. Both the annealing tests in an air atmosphere and in a vacuum furnace show no phase changes in the XRD diffractogram of the electroplated Cu/Sn solid solution phase. The results of the SkalaD project show that electroplated CuSn alloys with a tin content of 10 wt.% are basically suitable as a material for capacitive pressure sensor membranes at low strain and limited application temperature. However, further work is required to optimize the electrodeposition of free-standing diaphragm geometries in order to use them successfully as pressure sensor diaphragms.
Acknowledgements
The IGF project 19905N of the research association Hahn-Schickard-Gesellschaft für angewandte Forschung e.V. and the Forschungsvereinigung Edelmetalle und Metallchemie e.V. was funded by the Federal Ministry for Economic Affairs and Energy via the AiF within the framework of the program for the promotion of joint industrial research (IGF) on the basis of a resolution of the German Bundestag. The project was generously and constructively supported by the project staff. Many thanks to the staff involved: Ms. Willing, Ms. Pfeffer, Ms. Bretzler, Mr. Balzer, Mr. Merz and Mr. Richter (fem) and Mr. Schuhmacher (Hahn-Schickard). The authors would like to thank them for their support.
THE AUTHORS
Kayla Johnson (fem)
studied Materials Science (BSc and MSc) in the USA and completed a second Master's degree in Advanced Materials and Processes at the Friedrich-Alexander-University in Erlangen. She has been working as a research assistant in the Electrochemistry Department at the Research Institute Precious Metals + Metal Chemistry (fem) in Schwäbisch Gmünd since 2018.
Dr. Tobias Grözinger (Hahn-Schickard)
studied automation technology in production at the University of Stuttgart, specializing in microsystems technology. After his studies, he completed his doctorate at the Institute for Microintegration at the University of Stuttgart in the field of reliability of injection-molded circuit carriers and has been Head of the Modeling, Reliability and Analysis Group at Hahn-Schickard in Stuttgart since 2016.
Literature
[1] Instructions for the electrolyte Miralloy 3849, [Online] Available: https://ep.umicore.com/de/
[2] Instructions for the electrolyte Cu 830, [Online], Available: https://ep.umicore.com/de/
[3] D.A. Skoog; J.J. Leary: Instrumentelle Analytik, 4th ed., vol. 18, no. 1, Springer, Berlin Heidelberg, 1996
[4] A.J. Garratt-Reed; D.C. Bell: Energy-Dispersive X-Ray Analysis in the Electron Microscope, Garland Science, 2003
[5] W. Grimm: A new glow discharge lamp for optical emission spectral analysis, Spectrochim, Acta Part B At. Spectrosc., vol. 23, no. 7, Jun. 1968, 443-454
[6] German Copper Institute, Wrought copper-tin alloys (tin bronzes), 2004
[7] German Copper Institute, CuSn10-C material data sheet
[8] German Copper Institute, CuSn8 material data sheet, 2005
[9] German Copper Institute, Copper-tin and copper-tin-zinc casting alloys (tin bronzes), 2004
[10] P.S.G. Merseburg: Instrumentierte Härteprüfung- Methode Kenngrößen, 2019, [Online], Available: https://wiki.polymerservice-merseburg.de/index.php/Instrumentierte_Härteprüfung_-_Methode_Kenngrößen.[Accessed: 18-Nov-2019]
[11] K. Wegener: Creep, heat treatment, 2016
[12] S. Fürtauer; D. Li; D. Cupid; H. Flandorfer: The Cu-Sn phase diagram, Part I: New experimental results, Intermetallics, vol. 34, Mar. 2013, 142-147
[13] T. Watanabe: Microstructure Control Theory of Plated Film and Data Base of Plated Film Microstructure, 2004


![Abb. 9: Gleichgewichtsphasendiagramm des Cu/Sn-Systems [12] gt 2021 04 0076](/images/stories/Abo-2021-04/thumbnails/thumb_gt-2021-04-0076.jpg)
