The Ukraine conflict and current pandemic lockdowns in China have plunged the global electronics industry into even greater turmoil. The more or less stable price and supply structure until 2019 has become even more unstable for many suppliers at the start of 2022. This is compounded by massive inflation. This article shows the consequences of this for electronics production - especially for consumer electronics - and for the automotive industry.
The global electronics industry performed well until the end of March 2022. Since that month, however, the situation has changed for several reasons. One is the start of the Russian attack on Ukraine. This has made the availability of nickel, neon gas and other raw materials more difficult. The problem with neon gas is that between 45 and 54% of the gas used worldwide for semiconductor production is produced by two Ukrainian companies - Ingas and Cryoin. Another reason is the Covid-19 lockdown in China from south to north at the end of March this year. It initially affected Shanghai particularly severely, but was then extended to neighboring cities such as Kunshan and Suzhou. These cities are home to the largest concentration of production facilities of Taiwanese companies in the electronics industry. To date, there are still mixed signals regarding the development of the situation.
It is reported that Quanta Computer's Shanghai subsidiary, Shanghai Quanta Manufacturing City, which covers an area the size of 20 soccer fields and employs 40,000 people, has run into difficulties with Covid infections. Around three quarters of Macbook computers are manufactured here. As a result, Apple announced that they expect sales to fall by $8 billion in the second quarter of 2022. Quanta also assembles circuit boards for Tesla. The Chinese government's strict adherence to the zero Covid policy has been criticized by the international community. Texas Instruments also announced that its annual turnover could fall by up to 10% this year. With global annual sales of $18.34 billion in 2021, that could well be as much as $2 billion. Putin may be accused of waging a nonsensically expensive war against Ukraine, but if you put aside the terrible human consequences of the war, you have to add the economic losses caused by the very strict coronavirus measures in China.
Meanwhile, inflation is flaring up everywhere. In the United States, where the author lives, current inflation is said to be the highest in 40 years. The Federal Reserve has raised interest rates to mitigate inflation, but it is still high. A year ago, a gallon of mid-grade gasoline (about 3.8 liters) cost $3.2; today it's $5. The weather here in New York did gradually get warmer in March, but it wasn't until early May that it became stably warm. The author suspects that his heating oil costs will shoot up to more than 7000 dollars this year due to the large price increases. Yet the thermostats are already turned all the way down. He thought none of this would affect his life much, but it is starting to.
Two old friends, one European and one Japanese, recently told the author about their living conditions in Shanghai. They have been confined to their apartment complex since the end of March. The delivery of food is difficult. Neither of them will starve, but it is not possible to get the ingredients they need to prepare their favorite dishes. The friends wrote that their factory workers have done a good job to keep the plants running, but it is a struggle every day to get the necessary raw materials delivered.
Large PCB plants operated by Taiwanese are concentrated in Kunshan and Suzhou. There are mixed reports on their status every day: they are doing relatively well despite the lockdown, but sales will fall by 5 to 10%. At the beginning of May, it was still uncertain how the Chinese government's strict Covid policy would continue.
The price of lithium carbonate, an essential component of lithium-ion batteries for electric vehicles, rose in China from $7900/tonne in March 2021 to $78000/tonne in March 2022. An important source of nickel is Russia and Ukraine. Its price rose tenfold in just one month, from February to March 2022. These are the first effects of the Ukraine conflict, which began on February 24. As of the end of May, no one seemed to be able to predict when the war would end. Nickel is an important material for cathodes in EV batteries. Cobalt is also in short supply. 70% of the world's cobalt is mined in the Congo, and the terrible working conditions there have been criticized worldwide: Child labor and very poor pay. The magazine Nikkei Automotive reported that Tesla boss Elon Musk has recognized these problems and has switched the production of half of his batteries to other materials, in particular alternative metals.
The shortage of semiconductor chips is often cited. While a number of market research companies say that the shortage will be reduced in the second half of 2022, particularly for use in the automotive industry, Intel CEO Glesinger suspects that the chip shortage will continue until 2024. As several of its new plants will come on stream in 2024, his comments are likely to be correct from Intel's perspective. It is reported that in Germany, chips are being removed from used household appliances
are being removed to be used for automotive circuit boards. A friend in California who runs a small PCB assembly business said the same thing. His customers bring in old appliances and ask him to extract chips from them to assemble PCBs. It is not always easy to safely remove ICs without destroying them, he said, assessing the previously unfamiliar situation.
Not to forget the currency problems and their consequences. For example, the value of the Japanese yen has been drastically reduced. At the beginning of this year, it was trading at 107-108 yen per dollar. In May, the exchange rate fluctuated between 130 and 135 yen per $. A cup of buckwheat noodles, previously worth 350 yen, cost up to 1000 yen in May. Much of the buckwheat was imported from Russia, but the Japanese government stopped imports due to sanctions. Japan has now had to switch to imports from other countries and is therefore paying a 20% higher price due to the weakened exchange rate. This is all bad news, but there is also the good news that despite a negligible increase in Covid infections in the New York metropolis, life around the author is gradually returning to normal. Hopefully the situation will continue to improve, although Covid did not spare even his own family, and the author will be able to travel again. Thank you for your patience, as the foreword has become quite long. Let's start with the state of the semiconductor industry.
Semiconductor production
Despite the shortage of neon gas due to the Ukraine conflict, the semiconductor industry appears to have done well in the first quarter of 2022 and is continuing to make progress. Several industry analysts predict that the semiconductor chip business will reach the one trillion dollar mark by 2030. IC Insights forecasts that the chip business will grow by 11% to $680 billion in 2022. Mixed signals of scarcity and sufficiency will persist in the industry for the rest of this year. Last year's automotive chip shortage crisis led to a change in the economics of the automotive industry from 'just-in-time' to a reasonable amount of inventory. The current automotive PCB business seems to reflect this change. More will be said about this later.
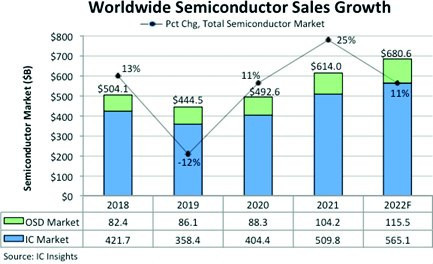 Fig. 1: Development of global semiconductor sales from 2018 to 2022 ($ billion)
Figure 1 shows the compound annual growth rates (CAGR) and values of global semiconductor sales from 2018 to 2021 and a forecast for 2022, divided into the two product categories IC and OSD. OSD stands for optoelectronics/sensors/discrete chips. The dots on the dash line indicate the respective annual growth rates. A note from the editors: For the sake of simplicity, the American spelling of the figures has been retained throughout the article in tables and figures.
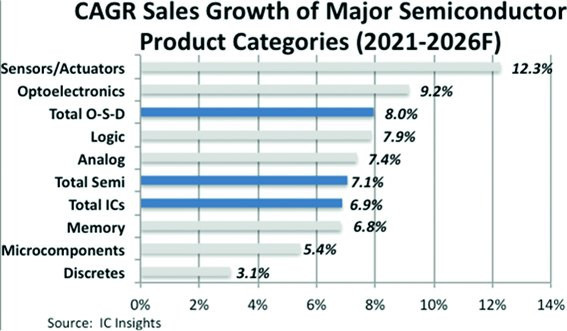 Fig. 2: Average annual growth rate for certain major semiconductor product categories for the period 2021-2026
Figure 2 shows the compound annual growth rate (CAGR) estimated by the market research company IC Insights for certain major semiconductor product categories for the period 2021-2026. According to the trend researchers, the highest growth rate is forecast for sensors/actuators (12.3%), perhaps because ADAS (advanced driver assistance systems) will play an increasing role in future vehicle production and Industry 4.0 will require more and more sensors. A CAGR of 7.1% is expected for the semiconductor industry as a whole and 6.9% for the IC sub-sector. This IC figure does not match the current growth in the production of IC package substrates, which is increasing by 20 to 30% per year and for which production capacities are currently being significantly expanded.
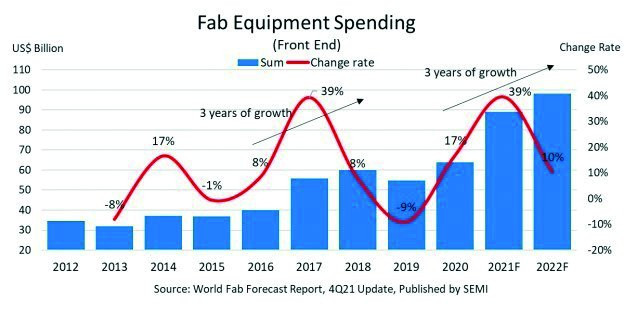 Fig. 3: Development of investments in equipment for semiconductor production and testing from 2012 to 2022 ($ billion)
The semiconductor manufacturers' association SEMI forecasts that sales of equipment for semiconductor manufacturing including testing will reach a level of USD 100 billion in 2022, which corresponds to an increase of more than 10 % compared to 2021(Fig. 3). Compare this figure with the semiconductor sales of almost $700 billion expected for 2022 as shown in Figure 1. Figure 3 also shows that sales of semiconductor production and test equipment will have almost tripled from 2012 (around $35 billion) to 2022. The growth rates will be particularly high in 2021 and 2022, partly due to the leading industrialized countries (USA, Japan, Germany) starting to build their own high-performance modern IC factories, but also due to the exponential increase in equipment costs with each IC node generation.
Smartphones
There are several market research companies that report on the smartphone market: IDC, Gartner, Counter Point, Canalys, etc. They all agree that smartphone shipments in Q1 2022 fell by 7 to 9 % compared to Q4 2021(Fig. 4). In their opinion, there are two main reasons for this:
- Component shortages
- Smartphone buyers do not see any major technological progress
Strangely, another possible reason, namely the impact of US sanctions in the chip sector against Chinese IC and electronics manufacturers such as Huawei, is not even mentioned. New quality parameters for smartphones require new, even more powerful integrated circuits based on new technologies.
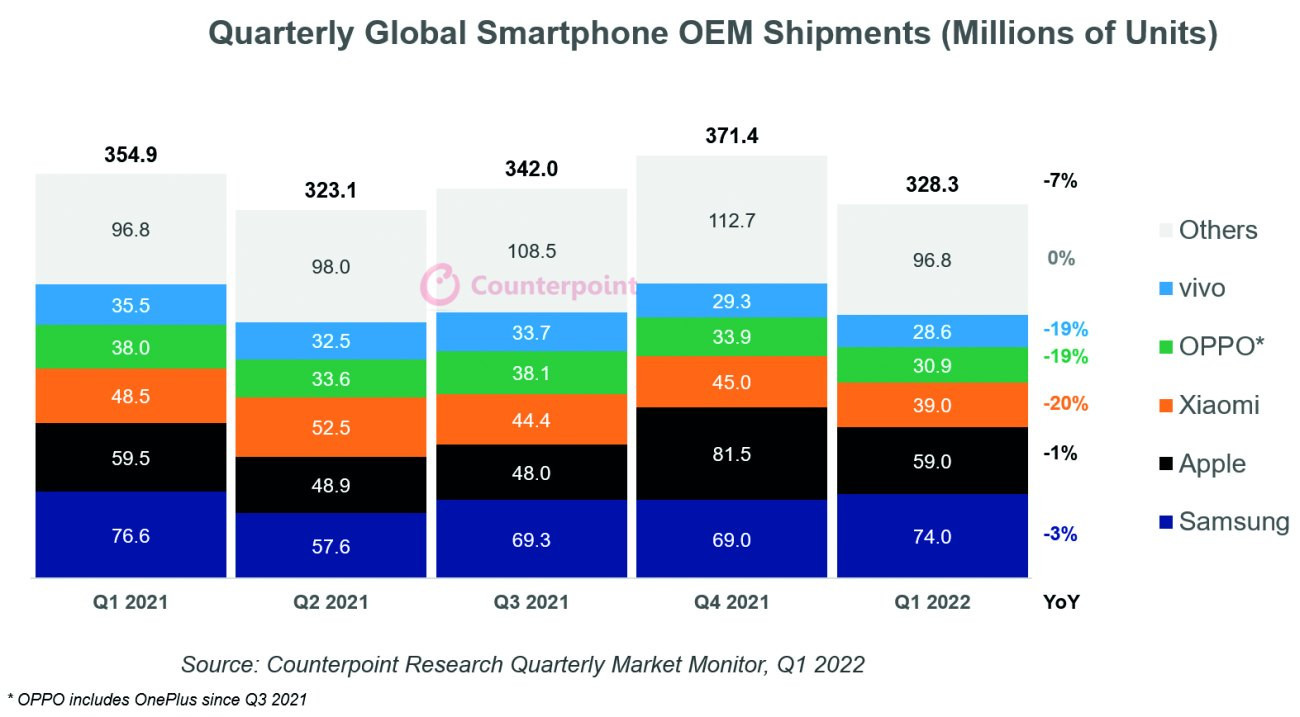 Fig. 4: Development of global smartphone sales in 2021 and the first quarter of 2022 (million units)
The Wall Street Journal reported on April 26, citing the Chinese 'East New News', that smartphone sales in China are currently not going well, partly due to component shortages, but much more due to low customer satisfaction. The figures in Figure 4 show that Vivo, Oppo and Xiaomi are severely affected by this.
Well-informed analysts state that buyers do not feel the urge to buy new phones because they cannot see dramatic new innovations. When new phones are purchased, transferring data from the old smartphone and restarting the application software is time-consuming and cumbersome. 'Longer battery life' and 'fast charging' are not enough to switch to new phones. Many potential buyers say that innovation in smartphones is at a standstill. What smartphone manufacturers are doing is pouring old 'sake' into a new glass. In China, more than 70% of smartphones in use are now 5G phones. Those smartphone users who are interested in 5G technology already own a 5G phone. In China, the much cheaper 4G phones sell better. So who knows? Smartphone sales in the USA fell by 24% from one month to the next in March. Is the situation similar here?
|
Producer |
Sales 1st quarter 2022 |
Market share 1st quarter 2022 |
Sales 1st quarter 2021 |
Market share 1st quarter 2021 |
Growth 1Q22-1Q21 |
|
1. samsung |
73,6 |
23,40 % |
74,5 |
21,60 % |
-1,20 % |
|
2. apple |
56,5 |
18,00 % |
55,3 |
16,00 % |
2,20 % |
|
3. xiaomi |
39,9 |
12,70 % |
48,6 |
14,10 % |
-17,80 % |
|
4. OPPO |
27,4 |
8,70 % |
37,5 |
10,90 % |
-26,80 % |
|
5. vivo |
25,3 |
8,10 % |
35 |
10,10 % |
-27,70 % |
|
Other |
91,4 |
29,10 % |
93,9 |
27,20 % |
-2,70 % |
|
Total |
314,1 |
100,00 % |
344,7 |
100,00 % |
-8,90 % |
In addition to the cumulative figures for global smartphone sales,Table 1 contains the sales figures for the world's five largest smartphone manufacturers for the first quarter of 2021 and 2022 and their market shares. Information on changes in sales during this period is also provided. Although the year-over-year figures for all the manufacturers mentioned turned negative, the Chinese companies Xiaomi, Oppo and Vivo were hit particularly hard.
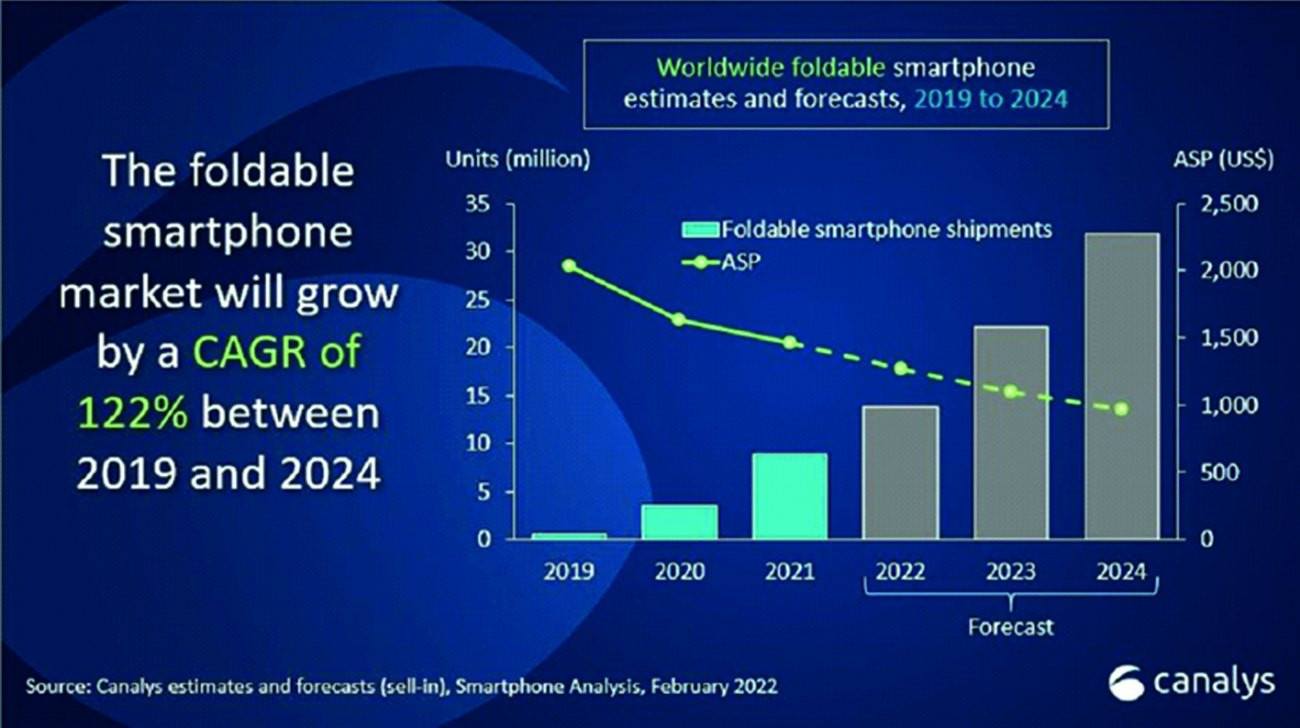 Fig. 5: Forecast by US market research firm Canalys for the development of sales of foldable phones (million units)
 Fig. 6: Samsung Galaxy Z Fold3 5G The Taiwanese electronics newspaper Digitimes has published a forecast for foldable phones by the US market research company Canalys(Fig. 5). Samsung is currently in the lead, but market analysts believe that Apple and Google will soon join the bandwagon. As Figure 5 shows, sales of such smartphones (or can they already be considered foldable tablets?) have increased almost tenfold from 2019 to 2021 because basic design problems have been satisfactorily solved. An annual growth rate (CAGR) of 122% is expected for the period from 2019 to 2024. The average selling price (ASP) is expected to fall below USD 1,000 by 2024. In Germany, the Samsung Galaxy Z Fold3 5G, flexible large 7.6-inch display, 128 GB memory, without contract currently costs € 1049 on Amazon(Fig. 6).
|
Year |
Devices |
Samsung |
|
2020 |
< 3 million |
< 3 million |
|
2021 |
9 million |
7~8 million |
|
2022F |
19 million |
12~14 million |
|
2025F |
28 million |
Apple, Google? |
|
F forecast |
(Digitimes, Feb 2022) |
Digitimes assumes that 28 million folding smartphones could be sold worldwide by 2025(Tab. 2). Samsung will probably dominate the field until 2022 with 12 to 14 million devices sold. What comes after that is uncertain, as Apple and Google are also working intensively on foldable smartphones.
Personal computers
Various market research companies presented their research results for PCs. The figures are slightly different, but all agree that PC shipments declined in Q1 2022. The same is true for Q1 2022 to Q4 2021 and Q1 2022 to Q1 2021. Figure 7 shows global sales of desktops and notebooks for the period Q1 2020 to Q1 2022.
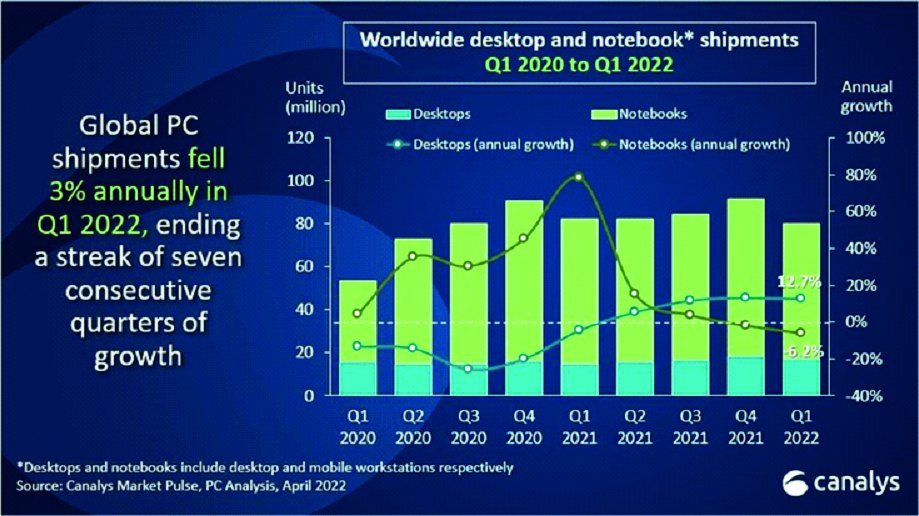 Fig. 7: Global sales of desktops and notebooks for the period from Q1 2020 to Q1 2022 (million units)
Canalys' estimate for Q1 2022 is minus 3%, while CounterPoint's estimate for Q1 2022/1Q 2021 is minus 4.7%. The decline may have been partly caused by component shortages, but the end of 'special orders' due to home office and 'remote learning' may well have had a greater impact.
|
Producer |
Sales 1st quarter 2022 |
Market share 1st quarter 2022 |
Sales 1st quarter 2021 |
Market share 1st quarter 2021 |
Growth 1Q22-1Q21 |
|
Lenovo |
18.258 |
23,6 % |
20.882 |
25 % |
-12,6 % |
|
HP Inc. |
15.863 |
20,5 % |
19.295 |
23,1 % |
-17,8 % |
|
Dell |
13.739 |
17,7 % |
13.084 |
15,7 % |
5 % |
|
Apple |
7.005 |
9 % |
6.449 |
7,7 % |
8,6 % |
|
ASUS |
5.594 |
7,2 % |
4.640 |
5,6 % |
20,6 % |
|
Acer |
5.531 |
7,1 % |
5.850 |
7 % |
-5,5 % |
|
Other |
11.503 |
14,8 % |
13.393 |
16 % |
-14,1 % |
|
total |
77.494 |
100 % |
83.592 |
100 % |
-7,3 % |
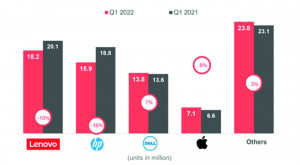 Fig. 8: Comparison of PC sales of the largest computer manufacturers in Q1 2022 and Q1 2021 (million units) The comparison of the development of sales of the world's largest PC manufacturers in Q1 2022 and Q1 2021 in Figure 8 and Table 3 clearly shows winners (Apple, Dell, Asus) and losers (Lenovo, HP, Acer). According to market analyst Gartner, total global sales of PCs fell by 7.3% within one year. The analysis company IDC comes to slightly different conclusions than Gartner. It assumes a global decline in PC sales of minus 5.1 %. Although both analysis firms probably assume the same figures for the six leading manufacturers in their findings published in April 2022, their figures differ slightly both in terms of the manufacturers' sales figures and total sales. To illustrate this, the IDC figures are also shown in Table 4. However, the greatest uncertainty in the work of the market research companies lies in the assessment of the value of 'Other/other manufacturers', which results in different estimates of total global sales and the equivalent year-on-year trend. Ultimately, it is probably all a question of the analysts' working methods. IDC has also drawn up a forecast for the sales development of PC monitors. Figure 9 shows that the global growth rate (YoY growth) of this computer accessory will be zero by 2026. This means that the growth in PC shipments will also be zero in the coming years. The annual production of monitors will level off at between 135 and 140 million units by 2026.
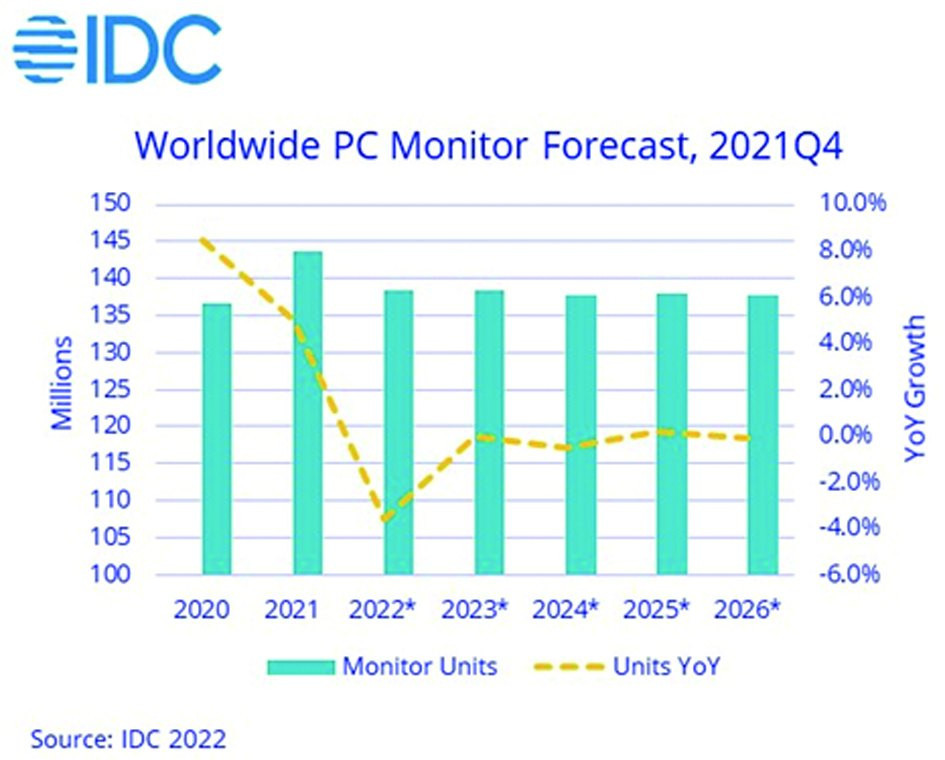 Fig. 9: Global sales development for PC monitors up to 2026 according to IDC (million units)
|
Producer |
Sales 1st quarter 2022 |
Market share 1st quarter 2022 |
Sales 1st quarter 2021 |
Market share 1st quarter 2021 |
Growth 1Q22-1Q21 |
|
Lenovo |
18,3 |
22,70 % |
20,1 |
23,70 % |
-9,20 % |
|
HP Inc. |
15,8 |
19,70 % |
19,2 |
22,70 % |
-17,80 % |
|
Dell Technol. |
13,7 |
17,10 % |
12,9 |
15,30 % |
6,10 % |
|
Apple |
7,2 |
8,90 % |
6,9 |
8,10 % |
4,30 % |
|
ASUS* |
5,5 |
6,90 % |
4,7 |
5,60 % |
17,70 % |
|
Acer Group* |
5,4 |
6,80 % |
5,8 |
6,80 % |
-5,90 % |
|
Other |
14,5 |
18,00 % |
15,1 |
17,80 % |
-4,00 % |
|
Total |
80,5 |
100,00 % |
84,8 |
100,00 % |
-5,10 % |
Tablets
The situation with tablets is similar to that of PCs. The end or reduction of home office and remote learning requires fewer tablets. Table 5 contains information from IDC on the five largest tablet manufacturers, their global shipments in Q1 2021 and 2022 and their respective market shares. While Amazon and Samsung can show a positive development in sales figures in the YoY comparison of the quarters mentioned, the sales volumes of Lenovo and Huawei literally plummeted. The overall trend on the global market was therefore minus 3.9%.
|
Producer |
Sales 1st quarter 2022 |
Market share 1st quarter 2022 |
Sales 1st quarter 2021 |
Market share 1st quarter 2021 |
Growth 1Q22-1Q21 |
|
Apple |
12,1 |
31,50 % |
12,7 |
31,70 % |
-4,60 % |
|
Samsung |
8,1 |
21,10 % |
7,8 |
19,60 % |
3,50 % |
|
Amazon |
3,7 |
9,60 % |
3,5 |
8,70 % |
6,30 % |
|
Lenovo |
3 |
7,80 % |
4,1 |
10,10 % |
-25,90 % |
|
Huawei |
2,2 |
5,80 % |
2,7 |
6,80 % |
-17,20 % |
|
Other |
9,2 |
24,10 % |
9,2 |
23,00 % |
0,60 % |
|
Total |
38,4 |
100,00 % |
39,9 |
100,00 % |
-3,90 % |
TV sets
From 2021, a slight increase in TV sales is forecast in 2022, as can be seen in Figure 10. The coronavirus pandemic may well be responsible for this positive development, as many people were forced to spend more time at home. It is difficult to predict whether sales will continue to increase after 2022, as this depends on several factors. For example, the further course of the Covid-19 pandemic cannot be predicted.
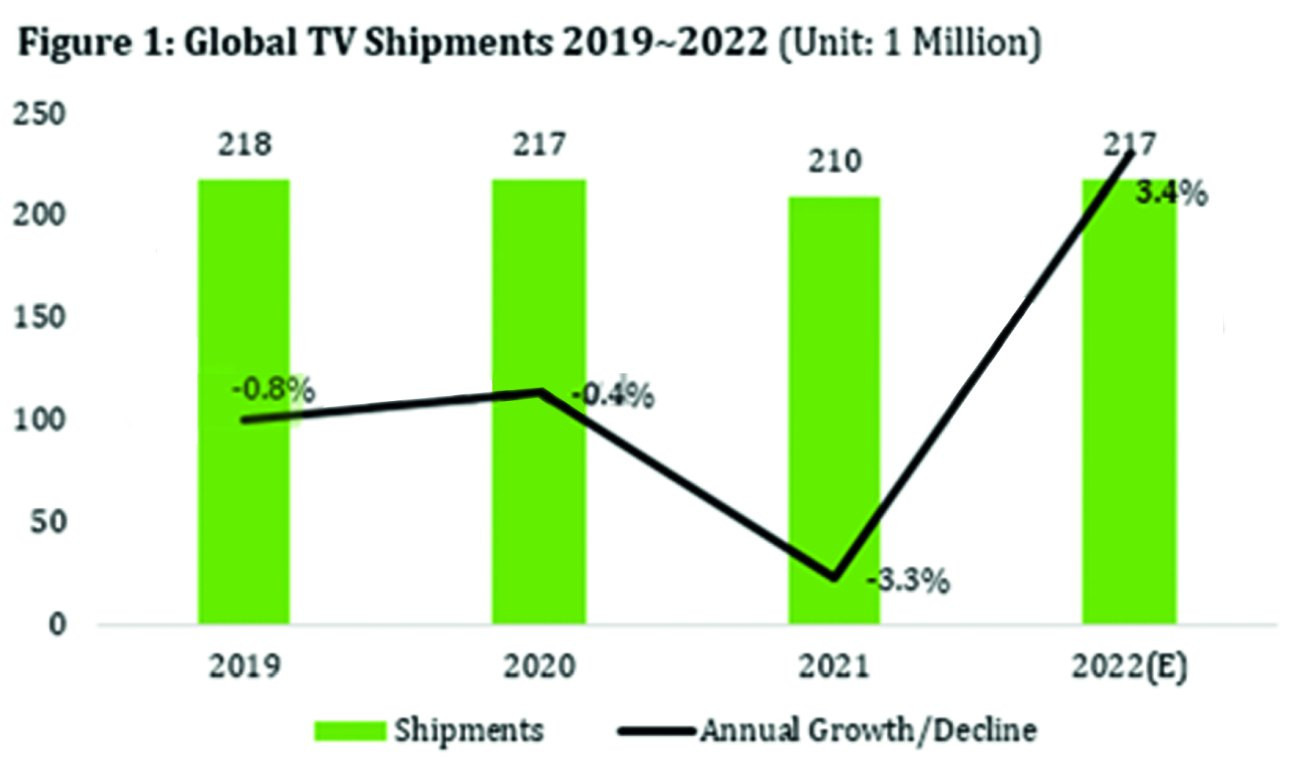 Fig. 10: Global development of TV set sales from 2019 to 2022 (million units)
Automotive
Automotive is the sector in which the author is most interested. He last reported on the status of this technology sector in PLUS 1/2022. However, he was only able to provide data on the situation up to and including August 2021. However, due to the rapid pace of development of electric cars and the constantly changing production and delivery situation, he would like to take the opportunity to inform readers about the situation at the end of the first quarter of 2022 or in April 2022. However, the market information is confusing at the moment. There are some optimistic and some pessimistic forecasts. The author conducted several phone calls and email interviews with well-known automotive PCB manufacturers in Asia. "We have large orders, but order release from the buyers is slow, depending on the type of customer and their models. Customers are often still missing components. Corona lockdowns in Shanghai and the surrounding area, i.e. Kunshan and Suzhou, are also beginning to have an impact on the production and distribution of components that are necessary for automotive electronics."
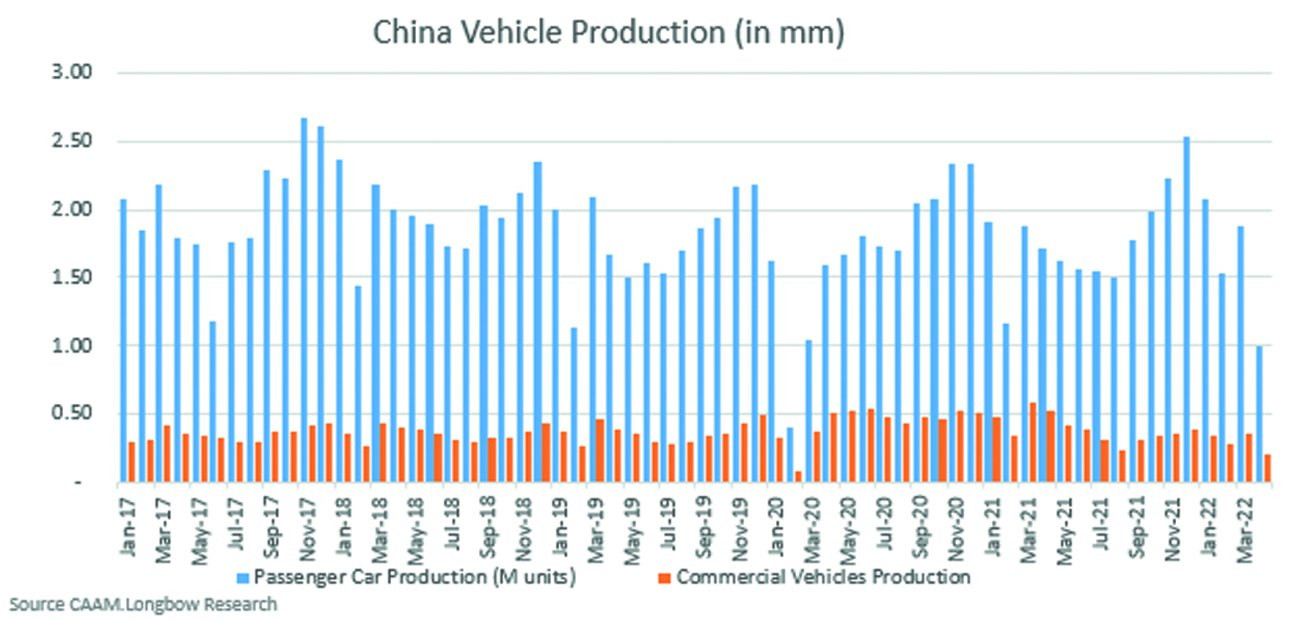 Fig. 11: Development of Chinese car production from January 2017 to April 2022 (million units)
According to various sources, car sales in China fell by 38% to 48% month-on-month in April 2022(Fig. 11). The Wall Street Journal (WSJ), citing the announcement of the China Passenger Car Association, stated that sales of passenger cars in China amounted to 1,040,000 in April this year. Production totaled 969,000 units, down 41% from March 2022. However, China sold 282 000 units of plug-in NEV (note that this figure is at odds with the figure shown later), an increase of 48% compared to April 2021. The NEV share was 28% of total car sales. Commercial vehicle production was also affected by the decline in March, according to Figure 11.
For a better understanding, here is the meaning of the abbreviations: The abbreviation EV includes battery electric vehicle (BEV), as the Europeans prefer to call it, plug-in hybrid vehicles (PHEV), hybrid electric vehicles (HEV) and fuel cell vehicles (FCV, Hydrogen Fuel Cell). The Chinese simply call them all New Energy Vehicles (NEV).
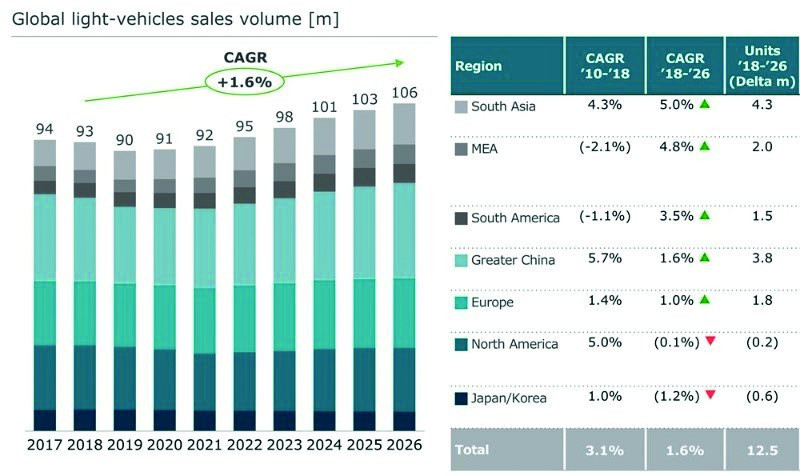 Fig. 12: Global sales forecast for passenger cars from Nikkei for the period 2017-2026 (million units)
Tesla Shanghai produced 10,757 units in April, but only sold 1,512 (?) of them. In March, 60,000 units were still sold. Toyota announced that it expects to produce 700,000 units in May, 50,000 units less than originally planned. The share of Japanese electric vehicles in total global sales is only 4%, while Japanese car manufacturers in general have a share of around 27% of global car sales. Quo Vadis?
According to the British market research company LMC Automotive, which is one of the leading analysis companies in the automotive sector, total car sales in Q1 2022 (year-to-date) in 'Western Europe' amounted to 2,476,816 units, which is down 11.3% compared to Q1 2021. The decline in the 1st quarter of 2022 compared to the 1st quarter of 2021 was recorded in all Western European countries with the exception of Portugal and Ireland. Italy (minus 24.4%), Sweden (minus 23.2%) and Finland (minus 22.4%) are at the top with the biggest drop. Germany still occupies a very moderate position at minus 4.6%.
The Japanese business newspaper Nihon Keizai Shimbun (Nikkei) demonstrated how difficult it is to make reasonably accurate forecasts. According to Figure 12, it gave an optimistic passenger car sales figure of 92 million for 2021. The actual figure was only 81 million. Whether 106 million cars can actually be sold in 2026 based on the current situation depends on many unknowns.
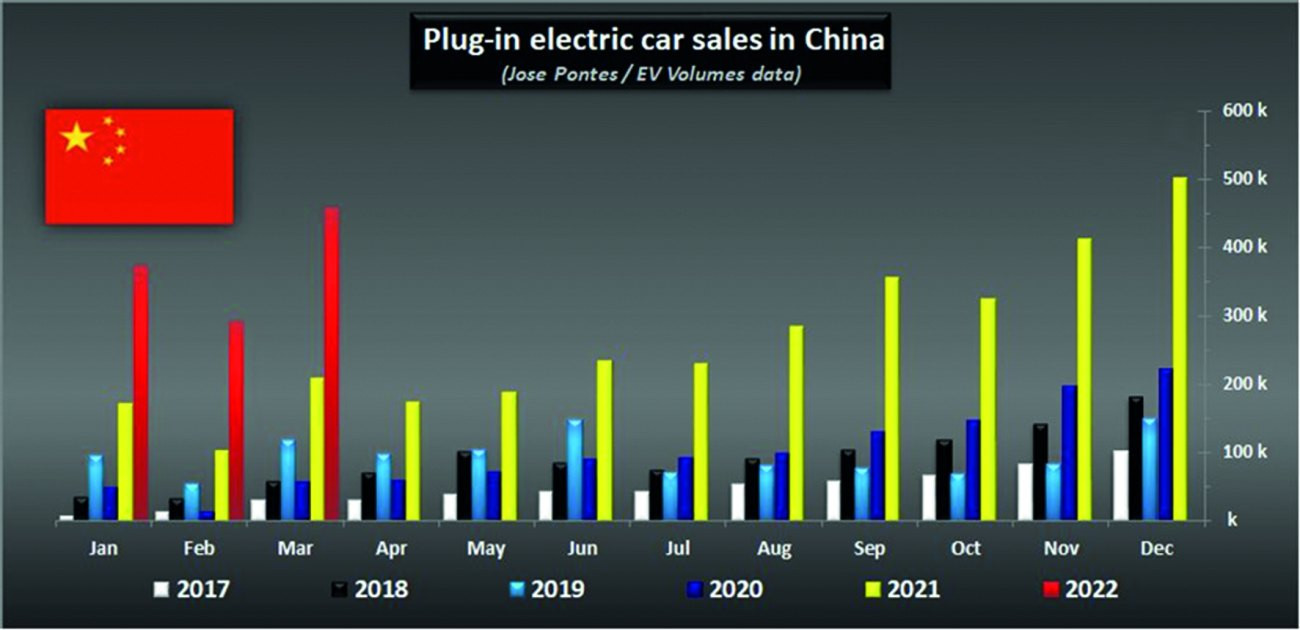 Fig. 13: Development of EV sales in China from 2017 to March 2022
Another thing is how quickly the transition to electric vehicles will take place. Despite the current general decline in car sales, their sales are flourishing. It seems to the author that EV manufacturers are targeting affluent customers first, who are not price-conscious. This is because many EVs that can travel 400 to 500 miles on a single full battery charge cost between $120,000 and $200,000, well out of reach of the 'common man'. As the number of EVs increases, new technologies developed for high-end models will transfer to lower-priced, more affordable models in the future. Then the popularity of electric vehicles will explode, he believes.
A friend of the author, who bought a Tesla Model S eight years ago, had to change the battery. The new battery cost him 27,000 dollars. For the original Model S, he paid 78,000 dollars minus a 7500 dollar incentive from the US government. At that point, the battery cost must have been more than 50% of the manufacturing cost. By using the Model S every day, he started driving fewer and fewer miles per full charge, and the charging time was getting longer and longer. So my friend decided to pay 27,000 dollars to get a new battery. Repeated recharging degrades battery life.
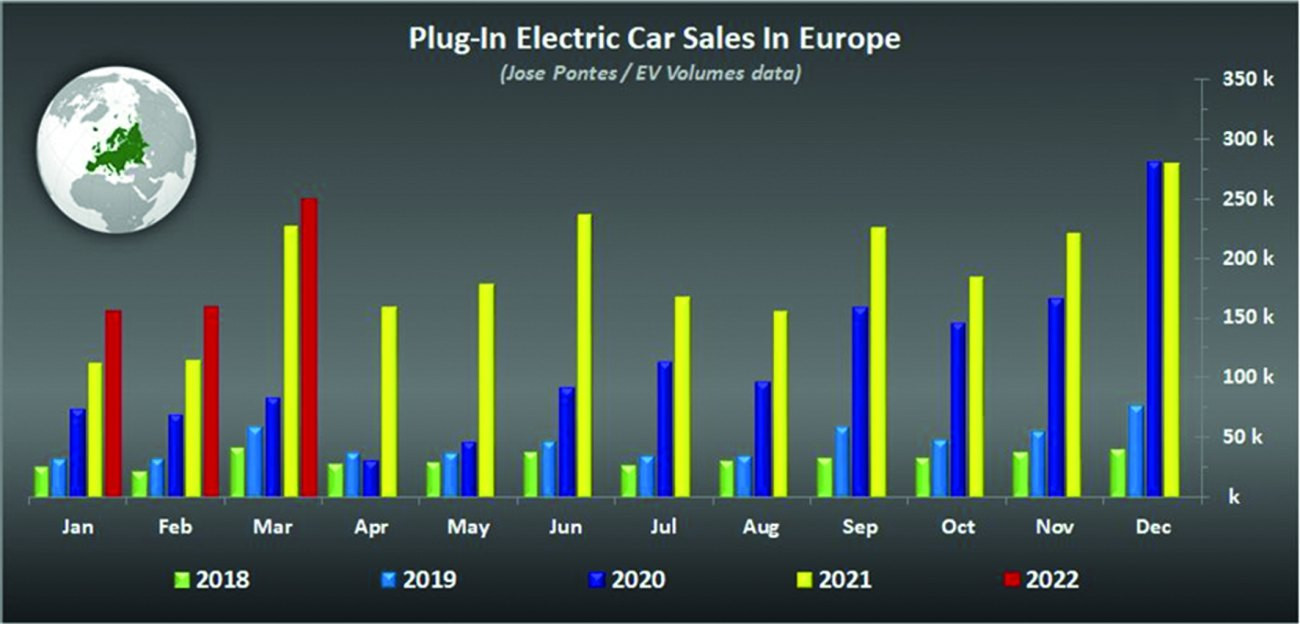 Fig. 14: Development of EV sales in Europe from 2018 to March 2022
Speaking of lithium-ion batteries, the price has continued to fall over the years, by 80 % in the last ten years. Currently, however, the battery price seems to have increased due to rising material costs and the shortage of certain ingredients. To compensate for this price increase, all EV manufacturers have raised their sales prices since the end of 2021 and continue to increase the price. The price increase so far is up to 30%, but not in one fell swoop - rather in two to three consecutive increases since the beginning of the year.
China's electric vehicle deliveries in March 2022 amounted to 458,273 units (+118% year-on-year compared to March 2021) according to Figure 13, accounting for 26% of total car sales in China. WSJ reported 282,000 EVs, as reported earlier. Why the difference? But there is other information: According to Taiwan-based Researcher and Research LLC, China's EV market reached 1.131 million units in the first quarter of 2022, with a compound annual growth rate (YoY) of 145%. Its share of the global electric vehicle market rose from 39.4% in the same period last year to 56.5% now. Apart from maintaining its position as the world's largest sales market for electric vehicles, China also had the highest annual growth rate among the global top 10 EV countries.
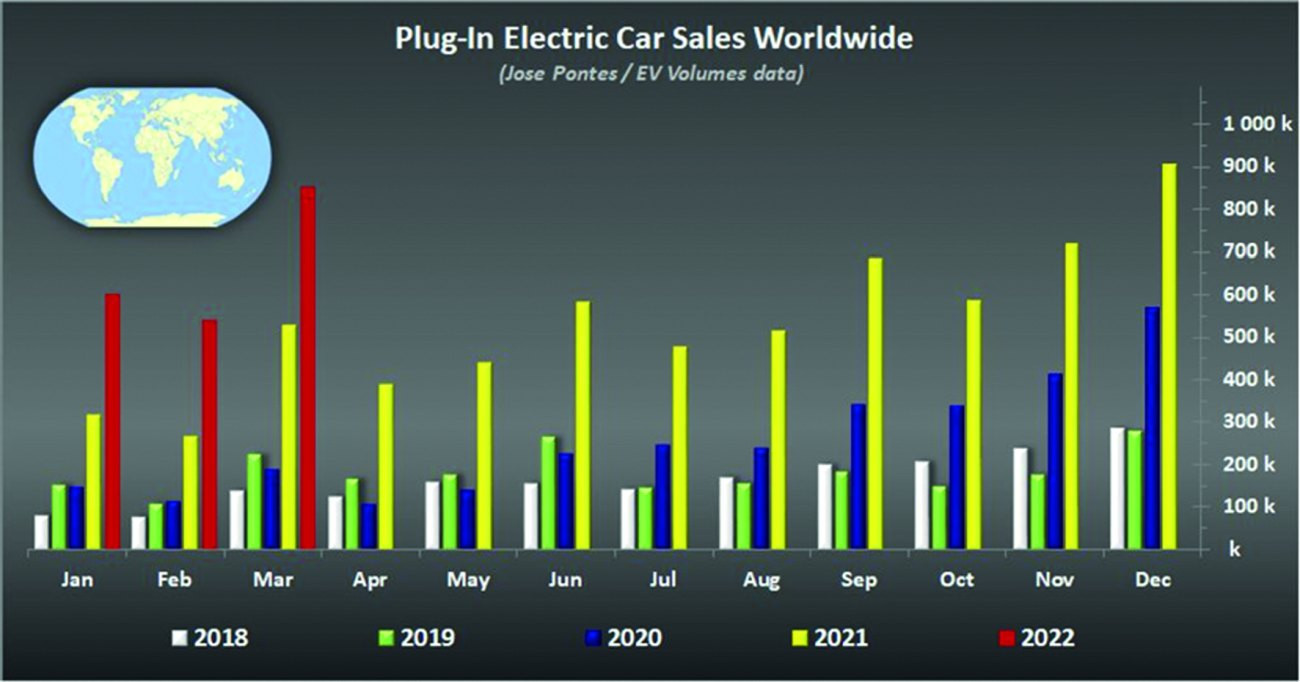 Fig. 15: Development of EV sales worldwide from 2018 to March 2022
Sales of electric vehicles in Europe amounted to 250,601 units in March 2022 (+10% compared to March 2021), accounting for 22% of total car sales in Europe(Fig. 14). An above-average increase can be seen compared to January and February 2022. Is the high inflation rate driving EV sales before everything becomes even more expensive? Or is it also the sharp rise in fuel prices and the uncertain political situation in Europe?
 Fig. 16: Honda wants to make a big impact on the EV market by 2030 In March 2022, 851,489 EVs were sold globally, an increase of 60% year-on-year. These are remarkable growth rates, but they are nowhere near China itself. It is only 15% of the total number of cars sold. Global EV sales in the entire first quarter of 2022 amounted to 1,997,348 units. At this rate, 10 million EVs in the whole of 2022 is hardly achievable, although there were already 6.5 million electric vehicles in 2021(Fig. 15). But here, too, there was a noticeable jump in sales in March 2022 compared to January and February.
In the US, the cumulative total of electric vehicles at the end of 2021 was 2,642,028 units, of which 1,135,387 units were sold in California alone, representing 43% of total US electric vehicle sales. But there is more to report about this US state: 84 different EV models available so far, plus 79 023 public battery charging stations and 54 hydrogen refueling stations.
Annual sales of passenger cars in Japan reached a total of 4.45 million in 2021, a decrease of 3.3% compared to 2020. In the first quarter of 2022, sales fell by 16.3% with 1.2 million units sold. It is certain that sales of electric vehicles in Japan will lag far behind China (1.4% of China) and Germany (6.8% of Germany). Japanese car manufacturers have therefore announced aggressive EV plans. Honda declared that it would only produce electric vehicles from 2030 and abandon its excellent ICE (Internal Combustion Engine) technologies (Fig. 16). The company has been selected by Sony as an EV partner. The target is two million EV vehicles per year and 30 models. Toyota announced plans to produce at least 3.5 million electric vehicles per year by 2030, while continuing to maintain ICE. Subaru unveiled its first EV model (SUV type) based on Toyota's EV platform. Nissan, Mitsubishi, Suzuki and other car manufacturers are 'finally' moving into the EV arena.
|
Company |
Model |
Starting price |
Starting range |
|
Canoo |
van |
$34 750 |
250 miles |
|
Fisker |
Ocean |
37 499 |
250 |
|
Tesla |
Cybertruck |
39 900 |
250 |
|
Ford |
F-150 Lightning |
39 974 |
230 |
|
Audi |
Q4 e-tron |
43 900 |
241 |
|
Nissan |
Ariya |
47 125 |
300 |
|
Lordstown |
Endurance |
52 500 |
250 |
|
BMW |
i4 |
55 400 |
245 |
|
Toyota |
bZ4X |
55 455 |
250 |
|
Kia |
EV6 |
58 500 |
310 |
|
Volvo |
C40 Recharge |
58 750 |
226 |
|
Cadilliac |
Lyriq |
59 990 |
300 |
|
Rivian |
R1S |
72 500 |
316 |
|
BMW |
iX |
83 200 |
324 |
|
Mercedes |
EQS |
102 310 |
340 |
|
Bollinger |
B1 |
125 000 |
200 |
|
Bollinger |
B2 |
125 000 |
200 |
|
Lotus |
Evija |
2 000 000 |
250 |
Finally, a price table for some EVs is presented, which was published by Bloomberg back in January 2022. Since then, however, prices have risen considerably(Table 6).
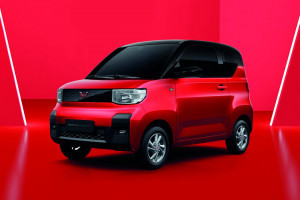 Fig. 17: Electric car Wuling Hongguang Mini from SAIC General Motors In the overview, it is noticeable that there is no electric vehicle with a price below $30,000. In this context, reference should be made to another table compiled by the Taiwanese Researcher and Research LLC. It provides an overview of the 20 best-selling EVs on the Chinese market in the first quarter of 2022 [1]. Among the 20 models, those from the Chinese BYD Auto Company Limited alone occupy eight positions. First place was secured by the Wuling Hongguang Mini model, which immediately achieved a market share of 9.4 %. By January 2022, a total of more than 500,000 units had been sold. It is a subcompact car marketed by Chinese manufacturer SAIC General Motors (General Motors and its cooperation partner SAIC - Shanghai Automotive Industry Corporation) under the Wuling brand. The market launch in China began in July 2020 and within a short space of time, the Mini replaced the Tesla Model 3 as the best-selling electric car. The basic version of the two-seater EV 'city car' costs less than €7,000. Depending on the size of the battery, it even costs between €3,700 and €5,000(Fig. 17). With the most powerful battery possible, the car has a range of 300 km. In addition to this bestseller, the joint venture is now launching the Nano EV. With a length of just 2.50 meters, the Nano is even smaller than the 2.92 meter long Hongguang Mini EV.
It can be assumed that these environmentally friendly small EV cars will meet the needs of many drivers who mainly use their current vehicle for short distances, for example to go to work or shopping - and would therefore do without a larger traditional vehicle.
Translation, editing and additions to the article: Dr. Hartmut Poschmann.
Notes/references:
[1] https://thernrcorp.com/index.php/2022/04/25/chinese-ev-market-grew-145-percent-annually-in-q1-2022/


