
The model presented can be used to calculate rinsing cascades, whereby immersion and spray rinsing can also be represented for non-ideal rinsing. Circulation rinsing, recirculation rinsing and spray chamber rinsing can also be calculated. Last part (continued).
6.4 Example: Spray chamber rinsing
In a rack system, 10 product carriers are put through every hour. 1.0 liter per product carrier is carried over from the treatment process and from all rinses. This results in a carryover volume flow of 10 lh-1. The average concentration in the treatment process is c0 = 40 gl-1. Three rinsing stages are available for rinsing the product. It should be checked whether it is advantageous to design the third rinsing stage as a spray chamber rinse.
Spray chamber sink
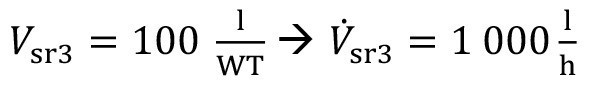
A spray chamber sink requires a relatively large amount of water per product carrier, as the goods are sprayed under considerable pressure as they are moved in and out. It can be assumed that 100 liters of fresh water are required per product carrier. This means for the spray rinsing volume flow:
<88>
Proceed as described in section 5.3 to model the spray chamber rinse. To represent the empty chamber, immersion rinsing is assumed to be completely ineffective. For this purpose, the factor of incomplete mixing of the 3rd stage is assigned according to equation <49
<89>
α3 = 1
The first two rinsing stages are classic immersion rinsing stages, for which the factors of incomplete mixing are assumed to be α1 = 0.006 and α2 = 0.1, again based on [14].
The effect of rinsing in the spray chamber is high, as intensive spraying takes place. It is assumed that 90 % of the residual soiling is removed in the spray chamber rinse. This means that the spray rinsing factor is
<90>
β3 = 0.9
However, no spraying takes place above the first two rinsing stages, meaning that the first two spray rinsing factors are zero.
The water from the spray chamber rinse is used to feed the second cascade rinse. This again results in a classic counterflow cascade. The overflow volume flows for the individual stages are calculated according to equations <26>:
V.of1 = V.of2 = V.of3 =1000 lh-1 <91>
Figure 18 shows the diagram of the cascade rinse with final spray chamber rinse. It can be seen that the excess volume flow from the spray chamber rinse is not a classic (gravity-driven) "overflow", but must be actively conveyed to rinse 2. However, as the entire surplus from the spray chamber rinse is transferred, the volume flow can be represented in the model as overflow volume flow V.of3.
 Fig. 18: Cascade rinse with final spray chamber rinse
With the overflow volume flows and the parameters listed above, the volume flow and coefficient matrix A (eq. <29>) and the entry vector b (eq. <30>) are formed. The concentration vector c can then be calculated according to equation <33>.
The corresponding calculated carryover concentration after the spray chamber rinsing of cdo3 = 6.94 mgl-1 results in the rinsing criterion:
<92>
Rw3 = 5 761
The concentration c3 specified in the concentration vector for the third stage represents the rinse water that flows from the spray chamber rinse to the second rinse. This results in a degree of dilution of Rt3 = 64 015. It can be seen that the large quantity of rinsing water causes a high degree of dilution here.
Combined immersion/spray rinse
We will now compare the ratios that result if, instead of the spray chamber rinse, there is an immersion rinse in the third position, over which the outgoing goods are sprayed with spray nozzles.
20 liters are sprayed per product carrier and thus the spray rinsing volume flow is
<93>
V.sr3 = 200 lh-1
A spray rinsing factor of β3 = 0.45 is assumed for the effect of the spray rinsing.
In order to compare the rinsing criterion with the same water input, fresh water is also fed into the third stage:
<94>
V.if3 = 800 lh-1
If the immersion time in the third sink is not very long, the incomplete mixing factor is assumed to be
<95>
α3 = 0,4
The factors of incomplete mixing in the first two sinks remain unchanged for the calculation above (α1 = 0.006; α2 = 0.1). Figure 19 shows the diagram of the cascade rinse with final immersion spray rinse.
 Fig. 19: Cascade rinse with immersion spray rinse
After setting up the matrix model and calculating the concentration vector, the rinsing criterion can be calculated:
<96>
Rw3 = 2 592
The degree of dilution of the rinsing solution in stage 3 is
Rt3 = 74 198.
Consequently, despite the considerable amount of water used for this scenario, the rinsing result of the final combined immersion/spray rinse is significantly worse than that of the spray chamber rinse. This is again due to the pronounced effect of incomplete mixing in the low-concentration third rinse. The effect of the non-ideal rinsing becomes clear when comparing the rinsing criterion and the degree of dilution.
As already discussed in example 6.2, the effects of incomplete mixing, particularly in the last rinse, can be counteracted by extending the rinsing time. By rinsing for several minutes, the factor of incomplete mixing in the last rinse should be significantly reduced to
<97>
α3 = 0,05
The model calculation carried out with otherwise unchanged parameters then results in a rinsing criterion of
<98>
Rw3 = 17 685
The degree of dilution is now Rt3 = 59 512 .
The comparison of the results in equations <96> and <98> shows impressively how important it is to rinse thoroughly (i.e. for as long as possible) in the last rinsing stage. The now very high rinsing criterion opens up the possibility of reducing the feed water. According to equation <93>, the spray rinse water should remain unchanged. However, the additional feed water is reduced to such an extent that the same rinsing result is achieved as with spray chamber rinsing(equation <92>). With an inflow of
<99>
V.if3 = 160 lh-1
the flushing criterion of Rw3 = 5 761 is also achieved here. Compared to spray chamber rinsing, the water consumption is therefore reduced from 1,000 lh-1 to 360 lh-1.
|
Spray chamber rinsing |
Combined immersion spray rinse |
|||
|
Spray rinsing volume flow V.sr3 |
1000 l/h |
200 l/h |
||
|
Inlet volume flow V.if3 |
- |
800 l/h |
800 l/h |
160 l/h |
|
Total water consumption |
1000 l/h |
1000 l/h |
1000 l/h |
360 l/h |
|
Spray rinse factor |
0,9 |
0,45 |
||
|
Factor of incomplete mixing Mixing factor |
1 |
0,4 |
0,05 |
0,05 |
|
Flushing criterion (product) Rw3 |
5 761 |
2 592 |
17 685 |
5 761 |
|
Dilution ratio (sink) Rt3 |
64 015 |
74 198 |
59 512 |
8 965 |
Table 1 provides an overview of the values calculated for this example. It can be seen that the question raised at the beginning of the example as to whether spray chamber rinsing is advantageous over combined immersion/spray rinsing cannot be answered universally. Spray chamber rinsing can achieve a high rinsing effect in a single step. However, a relatively large amount of water is required. With the same amount of water, a better rinsing result can be achieved than with combined immersion and spray rinsing if there are clear effects of incomplete mixing during immersion rinsing. This phenomenon is particularly pronounced in low-concentration final rinses [14]. However, if good mixing is ensured during immersion rinsing, the rinsing effect of combined immersion/spray rinsing is better than with spray chamber rinsing. Immersion rinsing for a sufficient period of time is the best way to achieve this.
7 Discussion
7.1 Special cases
As the examples in the last section show, the stationary rinsing system model presented in this paper is extremely versatile. On the one hand, almost all regularly used flushing structures can be calculated through the structural extension and, on the other hand, through suitable parameter selection. Nevertheless, there are still special cases that are not covered by the model or that require further special parameter assignment.
One such case occurs when drip trays are used to transport the goods. This is important for the calculation if a relevant part of the carryover volume is discharged from the process via drip trays. In this case, the structural assumption that the entrainment of a stage is equal to the entrainment of the previous stage is no longer fulfilled. In principle, however, this case can also be represented correctly by parameterizing the loss via the drip trays as "discharge" and assuming that only the part that actually arrives in the next stage is discharged.
Another special case is the discharge of rinsing solution via aerosols. This can be relevant in sinks, for example with air injection. This discharge cannot simply be described as evaporation, as not only water but also the substances it contains are lost. In order to be able to calculate this phenomenon with the model presented, it would also be possible to represent the aerosol discharge as "runoff".
7.2 Limits of the model
Chemical reactions are not included in the model. This means that if a substance is consumed or produced by chemical reactions in a flushing process, the model presented is no longer applicable.
Furthermore, any temporal changes in the flushing processes cannot be depicted. This is due to the basic assumption of equation <5>, which assumes that there are no more changes in the dissolved mass in a rinsing stage. This assumption means that stationary operating states are described. Mathematically, equation <5> marks the transition from differential equations to purely algebraic equations, which, as shown, lead to the matrix model presented.
There is a further limitation with full mixing. The difference between the concentration in the rinsing stage and the carryover concentration on the product is modeled with the factor of incomplete mixing. In addition, however, a homogeneous concentration within the rinsing stage is always assumed. This assumption is not always fulfilled in real rinsing stages. For example, in a rinsing cascade connected by an overflow, an unfavorable design can result in the incoming rinsing water flowing into the next sink before ideal mixing with the rinsing solution in the rinsing tank is achieved. The same is possible when water is supplied by spray rinsing. The corresponding risk of non-ideal complete mixing within the tank volume is particularly high in sinks, as these are often not circulated in contrast to treatment stages.
7.3 Model testing and parameter procurement
As with any mathematical model of real processes, the question of the correctness of the model is also raised here. A distinction can be made between two stages of model testing. The first concerns verification of the model. Here, implemented models are checked against a fundamentally different or more comprehensive model. The present model was checked accordingly with independently implemented dynamic models. In simulation experiments, the decay of all temporal transition processes was waited for and the resulting stationary states were compared with the results of the stationary matrix model. A second, more extensive test step is model validation with real process data. This assumes that the process already exists. Part of the validation is the testing of the model parameters used. For this purpose, the model parameters must be provided with sufficient accuracy. In addition, it must be ensured that the variables measured in the flushing process are already stationary, i.e. that they no longer change.
In principle, it should be noted that obtaining accurate process parameters is probably the most challenging task in achieving accurate model results. In practice, process parameters are often only known imprecisely. This is particularly true for the factors of incomplete mixing and for the spray rinsing factors. The effort required to determine these parameters is not insignificant. Only a few numerical values can be found in the technical literature (e.g. factors of incomplete mixing [9, 14], spray rinsing factors [9, 15]).
The situation is somewhat better for carryover. Area-related carryover values can be found for racks, e.g. in [17, 18]. On the other hand, the carryover for drum goods is usually specified per drum. In this case, the carryover values vary considerably depending on the size and design of the drum as well as for different goods. Two methods are particularly suitable for determining carryover in operational systems. The carryover can be determined using the enrichment method from the increase in concentration in a freshly prepared rinse [4, 19]. Another practical approach is the consumption method. This is based on the use of consumption values of substances that are lost exclusively via carryover [20].
It is easier to provide the actual design parameters of water inflow and spray rinse volume, as these are defined via pump capacities and dosing times. But even here there is considerable uncertainty in practice. Once a system has been implemented, the actual values for pumps or spray nozzles can sometimes deviate significantly from the specified nominal values of the device technology. If precise calculations are to be made here, the corresponding pump quantities or spray volume flows must be determined (i.e. "gauged").
Despite the practical difficulties in obtaining precise parameters for rinsing processes, rinsing calculations with roughly estimated parameters can also be useful. Many fundamental statements can be derived from such calculations. This applies in particular to comparative scenario calculations, which can only be carried out with imprecise parameters. One example is the comparison of water consumption when washing a particular product in a two-tier or three-tier sink. Even if such a calculation is carried out with clearly incorrectly assumed carryover, the relative reduction in water consumption when switching from two to three washing stages is clearly visible. However, if the actual amount of water required for wastewater treatment is to be calculated, the carryover must be known more precisely.
8 Summary
This article presents an extended model for calculating flushing systems. It is a further development of a previously developed matrix model that enables the calculation of steady-state conditions in multi-stage flushing cascades. In contrast to most literature models, the model presented here can take into account the effects of non-ideal flushing. Additional variants of the water feed can now be calculated using structural extensions. In addition, spraying with water from the subsequent stage as well as spraying with fresh water can now be represented for all spraying stages.
In addition to the structural extension, the range of applications of the model can be significantly increased by selecting suitable parameters. Accordingly, it was shown how ion exchange circuit rinsing, recirculation rinsing with different feed variants and spray chamber rinsing can be calculated.
Following the derivation and explanation of the model, a series of sample calculations were carried out in the article. This illustrates the practical application of the model. The four examples show the great flexibility in calculating very different variants of rinsing processes. Last but not least, the detailed numerical values of the example calculations offer the reader the opportunity to verify their own computational implementations of the model.
Literature
[1] Unruh, J.: Capable rinsing processes - rinsing quality according to ISO 9000. mo 50 (1996) 6, 462-469
[2] Clarke, M.: Rinsing: Part I - Theory of Recirculation and Chemical Rinsing, Transactions of the Institute of Metal Finishing, 46 (1968) 201-208
[3] Kushner, J.; Kushner, A.: Water and Waste Control for the Plating Shop, Cincinnati, Gardner 2nd ed. 1981
[4] Winkler, L.: Rinsing - Quality Assurance and Environmental Protection - Parts 1 to 10, Galvanotechnik, 85 (1994) 9 to 86 (1995) 12
[5] Kubík, C.: Rinsing - theoretical principles and calculations of rinsing systems - Parts I to X. Galvanotechnik, 88 (1997) 11 to 92 (2001) 4
[6] Fischwasser, K.; Schwarz, R.; Süß, M.: Stoffverlustminimierte Prozesstechnik - Wann lohnen sich Regeneratoren und Konzentratoren? Chemie Ingenieur Technik, 75 (2003) 6, 781-786
[7] Erlacher, N.; Hauser, H.: Rinsing is calculable and controllable - Part 1-3, Galvanotechnik, 104 (2013) 2-4, 333-336 / 554-557 / 777-778
[8] Giebler, E.: Simulation von Verfahrensprozessen - Bibliothek von Simulationsmodellen für galvano- und oberflächentechnische Verfahrensprozesse, Metalloberfläche, 57 (2003) 1/2, 21-26
[9] AiF-Vorhaben Nr. 14189 N , "Modellierung und Simulation von Verfahrensprozessen in der Galvano- und Oberflächentechnik,", Technische Universität Dresden, 2005-2007
[10] Reich, A.; Giebler, E.: Internet platform for the simulation of electroplating and surface technology processes, Oberflächentage 2006, Bonn
[11] Surface Technology Environmental Resource Center (STERC): Rinse Systems Calculator, www.sterc.org/subs/rinsecal.php (accessed August 2021)
[12] Giebler, E.: A General Steady State Model of Cascade Rinsing Systems, Transactions of the Institute of Metal Finishing, 82 (2004) 3/4, 75-82
[13] Giebler, E.; Röbenack, K.: Flexible design calculations for rinsing cascades - Part 1/2, Galvanotechnik, 98 (2007) 2/3, 474-480 / 753-759
[14] Buczko, Z.: Multistage Rinsing Systems in Electroplating Lines - New Method of Calculating Based on Imperfect Mixing Model, Transactions of the Institute of Metal Finishing 71 (1993) 1, 26-29
[15] Giebler, E.; Hauser, S.; Neumann, K.-H.; Reich, A.: Effective method for the investigation of spray rinsing processes. Galvanotechnik, 95 (2004) 1, 214-221
[16] Dietrich, G.: Hartinger - Handbuch Abwasser- und Recyclingtechnik, 3rd edition, Carl Hanser Verlag, Munich, Vienna 2017
[17] Stelter, M. and others: Development of an environmentally compatible technology for metal chemistry and electroplating, final report, research project BMBF 01RW0203, TU Freiberg, 2003
[18] Maaß, P.; Peißker, P. (Eds.): Handbuch Feuerverzinken, WILEY-VCH, 3rd ed., Weinheim, 2008
[19] Jansen, R.; Volk, S.: Verschleppung, SurTec Technical Brief 11, 2002
[20]Seeberger, J.: Process for the wastewater-reduced recovery of electrolytes from chemical treatment baths - Part 3. Galvanotechnik, 91 (2000) 5, 1410-1413
Formula symbol
A Volume flow and coefficient matrix
b Input vector
c Concentration in a rinsing stage
c Concentration vector
cmx Concentration (after incomplete mixing)
cdo Drag-out concentration (after incomplete mixing and spray rinsing)
m Mass of a dissolved substance
m. Mass flow of a solute
RtDegree of dilution (rinsing water-related rinsing criterion)
RwRinsing criter ion (product-related rinsing criterion)
t Time
V Volume
V. Volume flow
α Coefficient of incomplete mixing
β Spray flushing coefficient
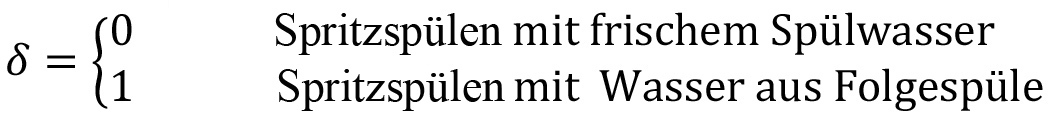
δ Structural parameter for the source of spray flushing
γ Degree of recirculation
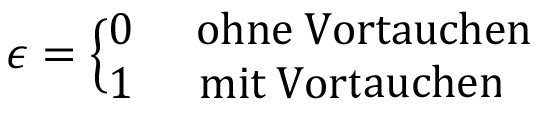
ε Structural parameter for pre-dipping
Indices
didrag in
doDrag out
evapEvaporation
IE Ionexchanger
i Counting variable
if inflow(in flow)
k Number of the rinsing stage
n Number of rinsing stages
ofoverflow
oloutlet
rtReturn (return)
srSpray rinse
t Rinse level(tank)
w Ware(ware)
