")
")
")

Almost nothing has changed in roughness measurements for decades, only the evaluation computers have become more powerful. There is now a whole range of optical methods as well as the need to be able to describe surfaces more comprehensively. In contrast to research, these standards are largely unknown in industrial practice and are not applied. Several series of measurements have shown that tactile and optical values forRa agree very well, while the other dimensions tend to be similar.
Basic principles
With optical methods, evaluations are also possible that can be very important for the characteristics and behavior of a surface in use. These include the autocorrelation length, the texture aspect ratio or isotropy coefficient, the texture direction and the transition surface ratio. It may be that simple values of a scan are sufficient to control a running mass production. However, it is of the utmost importance that the possibilities of modern measuring methods are used for the development of reliably functioning components in order to avoid faulty developments and product failures. More widespread use of modern optical methods offers greater safety for today's production facilities and also improves communication during design, communication with suppliers or in the case of expert opinions.
Roughness measurements on workpiece surfaces have been carried out since the 1940s. Simple devices and analog filter circuits were initially used to determine values such asRa. With the advent of digital measurement processing, it quickly became clear that it was possible to calculate measurement values that describe surfaces far better. For example, it is possible to imagine the characteristics of a surface from an Rz value, which is not possible with values such asRa or Rq. In addition, a large number of other measured values have been established that reveal additional characteristics of the surfaces, such as the comparison of the peak height with the groove depth, i.e. Rp with Rv. However, almost nothing has changed for decades when it comes to recording measured values, as measurements are still generally carried out using a tactile stylus instrument and a diamond tip. Only the evaluation computers have become more and more powerful.
There is now a whole range of optical methods for measuring or imaging surfaces, as well as the need to be able to describe surfaces more comprehensively due to the growing demands placed on workpieces. As optical methods can meet these requirements for comprehensive measurements, surface parameters have been developed and gradually standardized since the 1980s. For example, DIN EN ISO 25718 currently comprises 18 approved parts and drafts, starting with Part 6 from 2010 up to the draft of a new version of Part 2 from February 2020. In contrast to research, these standards are largely unknown in industrial practice and are not applied. This is partly due to the view that the previous values are still sufficient and partly due to the devices for measuring the surface parameters, which are more expensive and complicated. There are very often problems in the production and assessment of high-quality parts that would not occur if the new possibilities were known and consistently applied.
Another factor hindering the spread of surface roughness measurements is the complexity of some parameters and their interpretation. The draft of DIN EN ISO 25718, Part 2, alone has 128 pages (bilingual) and various parameters such as Sq, Ssk orSku are explained with double integrals or Sdr or the calculation of the factors α and β of the gradient density function with partial derivatives [1], which is not comprehensible for practical users in industry without the corresponding mathematical knowledge. As the number of possible parameters is also increasing and with it the difficulty of interpretation as well as the possibility of errors, an "assistance system for areal optical roughness measurement technology" has already been developed to standardize the application more and to eliminate some of the possible errors [2].
Scattering width of 2D profile sections
In order to qualify optical measurement methods reliably, it is first necessary to prove that the same roughness is measured with both methods. This has already been demonstrated using measurements with roughness standards. This paper [3] shows that the deviations between tactile and optical measurements are smaller than those between individual measurements and the values entered in the calibration certificate.
Test series 1 with machined workpieces
 Fig. 2: Flat surface of the milled workpiece
On two workpieces made of the copper-zinc alloy CW713R (formerly 2.0550), the flat surfaces of round parts with a diameter of 25 and a length of 25 mm were face-milled once(Fig. 1: CNC lathe DMG CTX310 with carbide indexable insert) and once over-milled with an end mill(Fig. 2: DMU 50 eco, clamped in a jaw chuck) in order to obtain a practical surface in each case [4]. For both parts, an area outside the center was first marked with a felt-tip pen where the measurements were to take place. Figures 3 and 4 show the surfaces taken directly from above with the white light interferometer (MicroProf 200 from FRT, Bergisch-Gladbach). Here, too, it is clear that the surface quality is average for mechanical engineering (roughness values later in the text).
The good results from the literature cited above could not be reproduced, not least because the fluctuations between individual measurements within the marked square are already very large. This is partly due to the fact that the surfaces are relatively rough and somewhat irregular and partly due to the fact that although the direction of the measurements was maintained (always parallel to the sides of the marked square), the direction of the individual measurements was not uniformly perpendicular to the grooves.
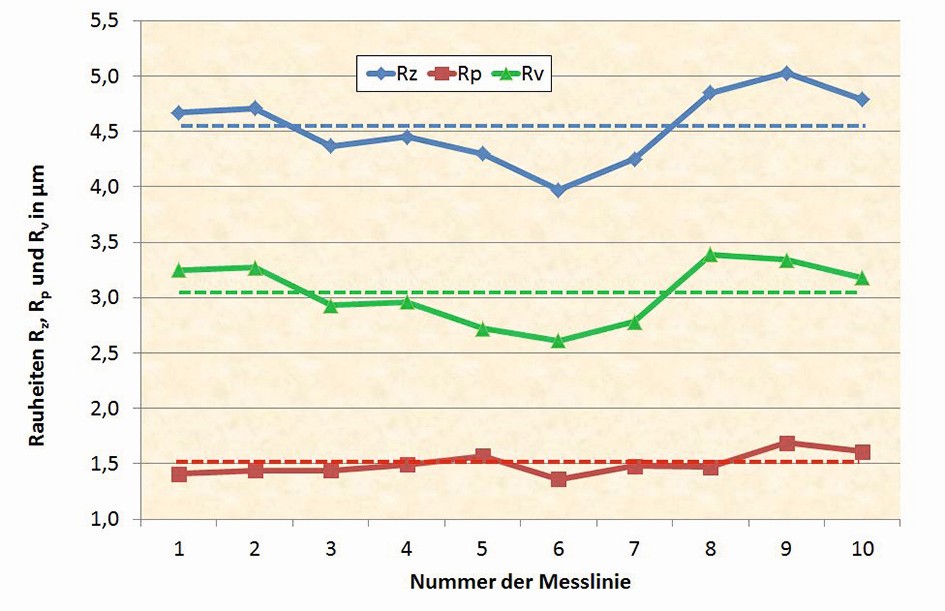
First, 10 adjacent measurements were taken on the marked area at a distance of approx. 0.5 mm using a Jenoptik T8000CR stylus instrument with the standardized setting, seen in a perpendicular direction in Figures 3 and 4 (like the coloured lines in Fig. 4). Figure 5 shows the roughness profile of the first line on the far left in Figure 4 and Figure 6 shows the evaluation conditions for this measurement as an example. The results of the best-known roughness valuesRa, Rz, Rq, Rp and Rv show a large scatter range of around ± 10 % around the mean value for the rotated surface (Fig. 7 and 8). The measurements are reliable, as the measuring device only produces a deviation in the range of significantly less than 1 % when measuring a calibration standard and the sum of Rp and Rv for both the individual measurements and the mean value produces the value of Rz, which is not defined as such but is normally the case.
") Fig. 3: Section of the rotated flat surface (white light interferometer image)
Fig. 3: Section of the rotated flat surface (white light interferometer image)
") Fig. 4: Section of the milled flat surface (white light interferometer image)
Fig. 4: Section of the milled flat surface (white light interferometer image)
The same measurements were carried out with the aforementioned white light interferometer, whereby, in view of the scattering, care was not taken to ensure that exactly the same measurement track was measured, but rather that adjacent measurement tracks were also drawn for this measurement, roughly along the lines in Fig. 4.
 Fig. 5: Example measurement along line 1 with the stylus instrument on the rotated surface
 Fig. 6: Evaluation conditions for the measurements with the stylus instrument
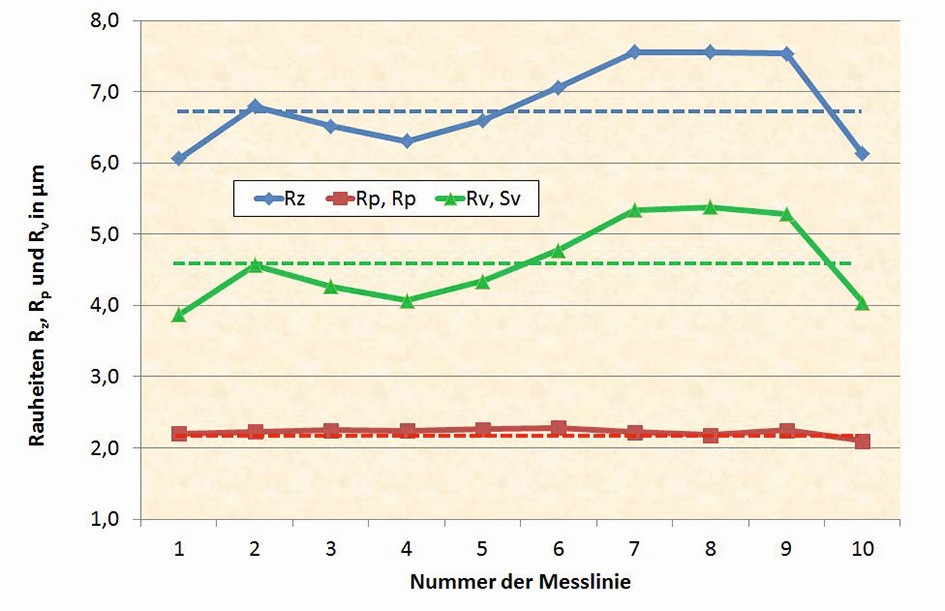
The milled part was measured in the same way, resulting in a scatter width of comparable dimensions (Fig. 9 and 10). Overall, the milled surface is somewhat rougher than the turned surface. The trend between the mean valuesRa and Rq compared to Rz can be traced for both the turned and the milled surface. It can also be seen that the scattering of Rz is mainly due to Rv and not to Rp, i.e. the elevations are reasonably uniform and the indentations determine the course of Rz over the individual measurement tracks. With these differences between about 6 and 7.6 µm for Rz of the individual measurements, a scatter of this magnitude can also be expected when comparing the tactile with the optical measurement.
 und 8 (rechts): Taktil gemessene Rauheitswerte Ra, Rq, Rz, Rp und Rv der gedrehten Fläche; Mittelwerte gestrichelt") Fig. 7 (left) and 8 (right): Tactile roughness values Ra, Rq, Rz, Rp and Rv of the turned surface; mean values dashed
Fig. 7 (left) and 8 (right): Tactile roughness values Ra, Rq, Rz, Rp and Rv of the turned surface; mean values dashed
 und 10 (rechts): Taktil gemessene Rauheitswerte Ra, Rq, Rz, Rp und Rv der gefrästen Fläche; Mittelwerte gestrichelt") Fig. 9 (left) and 10 (right): Tactile roughness values Ra, Rq, Rz, Rp and Rv of the milled surface; mean values dashed
Fig. 9 (left) and 10 (right): Tactile roughness values Ra, Rq, Rz, Rp and Rv of the milled surface; mean values dashed
Figures 11 and 12 show the values ofRa and Rz in comparison of the measurements with the tactile and optical measuring device for the turned part and Figures 13 and 14 for the milled part. Care was taken to ensure that the length of the measured distance corresponds approximately to that of the tactile measuring distance and the entire evaluation length of approx. 4 mm was divided into 5 individual measuring distances, as in the tactile measurement, so that comparable conditions can be assumed. The short-wave filter was also switched on with λs = 2.5 µm.
 und 12 (rechts): Rauheitsmesswerte Ra und Rz der gedrehten Fläche taktil und optisch gemessen") Fig. 11 (left) and 12 (right): Roughness values Ra and Rz of the rotated surface measured tactilely and optically
Fig. 11 (left) and 12 (right): Roughness values Ra and Rz of the rotated surface measured tactilely and optically

 und 14 (rechts): Rauheitsmesswerte Ra und Rz der gefrästen Fläche taktil und optisch gemessen") Fig. 13 (left) and 14 (right): Roughness values Ra and Rz of the milled surface measured tactilely and optically
Fig. 13 (left) and 14 (right): Roughness values Ra and Rz of the milled surface measured tactilely and optically
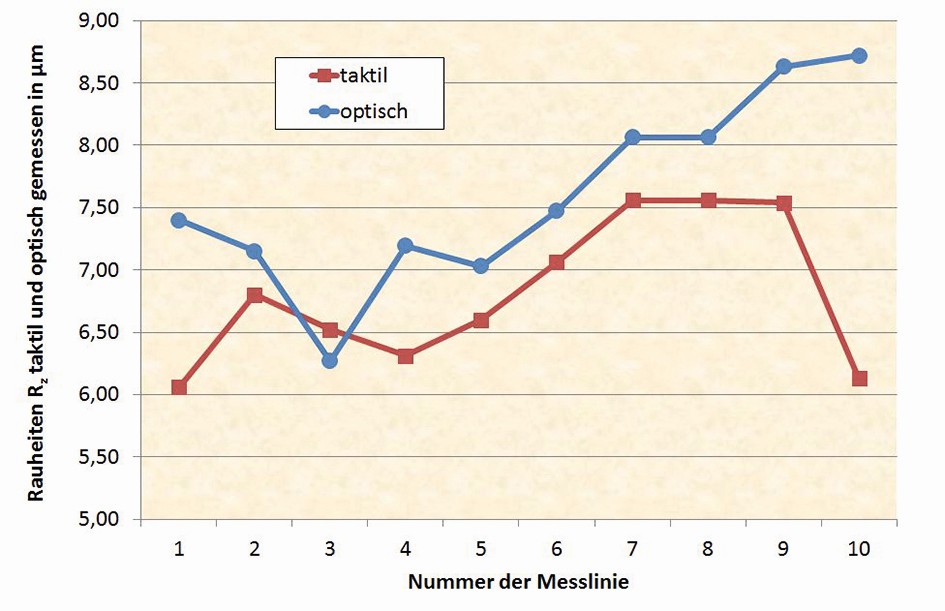
It can be seen that, at least for the turned part, the value forRa corresponds very well, while the other curves tend to indicate a general trend. With the exception of individual points, the optically measured values are always slightly higher than those measured tactilely. This is probably due to the precise, non-contact measurement of the optical sensor, which can also capture details with a very small focus point that the tactile sensor "rounds off" or averages. In the case of tactile measurement, it is noted (Fig. 6) that the registered point distance is only around 0.1 µm, but this is not necessarily meaningful with a probe tip radius of 2 µm and cannot be used to justify greater accuracy. With some optical devices, it is possible to simulate a probe tip mathematically by entering a probe tip radius, which further approximates the measured values.
Introduction of the surface parameters
In order to compare the results obtained from two-dimensional measurements with the surface parameters, these must be described at least briefly to avoid having to refer to the standards. As already indicated in the basics, it would be too extensive to explain and discuss all the measured values, so only the values relevant to this work are listed.
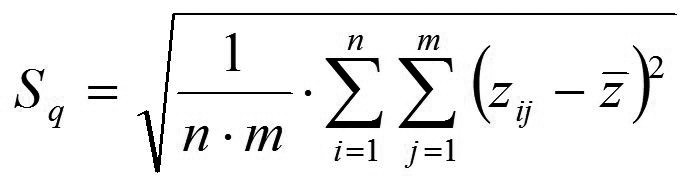
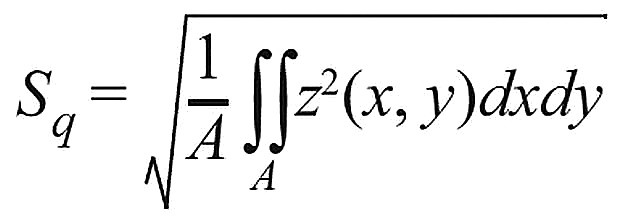
The area values, which generally have an S (for surface) instead of an R (for roughness), are, for example, in the case ofSa and Sq, simply to be understood in such a way that at least in the formula the roughness in one direction is multiplied by a roughness at right angles to it (formula of Sq as an example in Fig. 15). This is similar to multiplying a length by a width. However, while the product of two lengths at right angles to each other is easily understood as an area, this is not the case with roughness and the product cannot be visualized. As can be seen in the formulas, in the case of the area parameter, a further term is added to the term under the root as with Rq (i = 1 to n) multiplicatively with the numerators j = 1 to m. A comparable transfer to the surface applies to the skewness Ssk for Rsk and to the kurtosisSku instead of Rku for the roughness.
 und des Flächenwerts S0 (mitte und rechts)") Fig. 15: Equations for calculating the two-dimensional roughness value Rq (left) and the area value S0 (center and right)
Fig. 15: Equations for calculating the two-dimensional roughness value Rq (left) and the area value S0 (center and right)
or
In addition to these two mean values, everyone would expect the equivalent valueSz for Rz, which is not defined as above, but differently. While the maximum roughness values of the five individual measurement sections are averaged for Rz,Sz is the distance between the highest elevation and the deepest depression within the surface under consideration. This means thatSz is most comparable to the outdated value Rt, because forSz the surface is not divided into 5 partial areas and then the individual values are averaged, as is the case with Rz, but the entire surface is considered without subdivision. In addition, most measuring devices also output the values forSp andSv, which can be seen as analogous to Rp or Rv. However, the definition differs here too. The two-dimensional measured values Rp and Rv are defined as the highest elevation or the deepest depression within a single measuring section. However, most devices output an average value from the five individual values of Rp or the five individual values of Rv. ForSp andSv, the definition of the individual measured value applies, i.e. the value for the highest elevation or for the deepest depression within the area under consideration. In the meantime, however, there are comparable values for the surfaces in the standard for the roughness values described, namely the five-point peak height S5p and the five-point trough depth S5v as well as the ten-point height S10z derived from these. In the case of the five-point values, the five highest peaks and the five deepest troughs are averaged in a similar way to the roughness, and in the case of the ten-point height, these two average values are added together, resulting in a value that is more comparable to Rz, as Rz can usually also be calculated as the sum of the average values of Rp and Rv. Unfortunately, these values are not (yet) included in many measuring devices, nor are they included in the devices used.
Until now, the measured values according to DIN EN ISO 13565, i.e. Rk, Rpk and Rvk, as well as the derived contact ratiosMr1 andMr2, have not been considered. For the surface measurement of roughness, there are measured values that correspond quite precisely to these R values, which are designatedSk,Spk,Svk,Smr1 andSmr2 and are explained in the sketches using the Abott curve in exactly the same way as for roughness.
- to be continued -
Literature
[1] E DIN EN ISO 25178-2: Geometric product specification (GPS) - Surface finish: Planar - Part 2: Terms, definitions and surface characteristics, Beuth-Verlag, Berlin, 2020
[2] Wiehr, C.: User support for the use and verification of optical 3D surface measuring devices, dissertation, Technical University of Kaiserslautern, 2019
[3] Ströer, F.; Seewig, J.; Depiereux, F.: Roughness measurement tactile or optical? Comparable results, QZ 59(2014)5, 70-72
[4] Plein, C.: Comparative surface topography, student research project, Cooperative State University, Lörrach, 2018
[5] Schorr, D.: Measurement of the Steinbeis Transfer Center Tribology in Application and Practice, Karlsruhe, 2018
[6] https://commons.wikimedia.org/w/index.php?curid=44998701
