The established CASS test can reliably test the functionality of nickel-chromium corrosion protection systems in chromium(VI) processes. With the change in technology to chromium(III) coating processes, simulation procedures were carried out to adapt the CASS test. This also provided insights into chromium(VI)-free passivation, which should further improve the corrosion resistance of chromium(III) processes.
Basics of the active corrosion protection system
The nickel-chromium corrosion protection system for automotive exterior applications is very complex. It is based on a multilayer nickel coating with a light-colored final chromium layer, which is traditionally deposited from electrolytes containing chromium(VI) [1]. Microcracks or micropores are created by targeted disturbances in the layer structure, thus creating an active corrosion protection system. If the coating system is damaged, e.g. by stone chipping, the unavoidable corrosion pressure caused by corrosive media such as road salt is distributed over many small, active "weak points". Due to the large number of very small "weak spots", however, the unavoidable corrosion is not visible to the human eye. The CASS test (Copper Accelerated Salt Spray) [2] is an established way of testing the functionality of the active corrosion protection system. After 24 h storage and 48 h corrosion test, a prediction can be made as to whether the corrosion protection system is functional.
The process is controlled by the additional measurement of nickel and chromium layer thicknesses, potential differences between the nickel layers and the counting of micropores or microcracks in order to reliably pass the CASS test and thus the long-term behavior in the field. The micropores are usually determined using the Dubpernell or Fuhrmann test [3-5]. Here, the number of pores is determined indirectly via copper deposition on exposed nickel. By and large, this measurement correlates quite well with the number of active corrosion sites according to the CASS test. However, the GM standard [6] already documents that the determination of Dubpernell pores usually generates more pores than active sites. For this reason, most automotive companies require approx. 10,000 pores/cm2, although often 2000 active sites/cm2 are sufficient to meet the corrosion requirements.
Due to the ecologically motivated technology change of chromium coatings, which use chromium(III)-containing processes instead of chromium(VI)-containing electrolytes, special problems arise in the exact measurement of pore numbers. The so-called chromium(III) processes do not currently work with microcracked systems, which is why only microporous systems are discussed below.
There are two fundamentally different types of chromium(III) processes, purely sulphatic and mixed, which contain a high proportion of chloride ions. There are also light and dark depositing variants, some of which differ significantly in the chromium content of their layers. Dark-depositing chromium(III) variants actually always produce chromium alloys. The characteristics of these processes have two decisive differences to the traditional chromium layers that are deposited from electrolytes containing chromium(VI). They usually have a significantly higher resting potential, which provides advantages in terms of resistance to calcium chloride [7], but at the same time increases the corrosion pressure on the underlying less noble nickel layers. Chromium layers deposited from chromium(III) electrolytes are not closed, but have microcracked or microporous structures. In addition to the real micropores, which are created by solids in the last nickel layer and make contact with the least noble bright nickel layer, the structures of the chromium layer create apparent micropores, which are also determined in the conventional measuring methods (determination of the number of pores). Chromium(VI)-containing baths have another property that chromium(III)-containing baths do not have. During deposition, the chromic acid passivates all exposed nickel surfaces, including any microcracked or microporous substructures in the chromium layer. The passivating effect of the chromium(VI) process also slows down the corrosion process. Chromium coatings deposited from chromium(III) processes are therefore usually additionally post-treated (passivated). The different passivations make the whole system even more complex.
Another method for determining the number of pores on chromium(III) systems is the Fechner test [8]. Here, instead of depositing copper on nickel, a corrosion current is applied in a cell containing the sodium chloride solution of the salt spray test, or NSS test (Neutral Salt Spray) for short [2]. A constant anodic current density is applied to the nickel-chromium system for a certain period of time and the number of active corrosion sites is subsequently counted. However, a test on various chromium(III) coatings showed only partial agreement with the active corrosion pores after 48 h CASS test (Fig. 1).
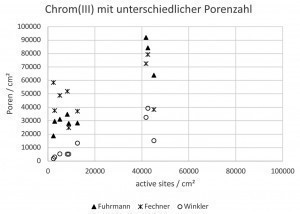 Fig. 1: Comparison of active sites after 48 h CASS with conventional counting methods of pores and the electrochemical simulation on bright Cr(III) surfaces (TriMac BLUE, MacDermid Enthone)
Description of the new simulation method
As a possible improvement for a corrosion-based rapid test, it was obvious to change the type of current conduction and corrosion solution. To accurately predict the CASS test result, it was recommended to use the CASS test solution. Corrosion as in the CASS test, which works without external current, is always controlled potentiostatically and not by a current density. Due to its composition, the corrosion solution always has the same redox potential. The chromium-nickel layers depend on the type of process and determine the rate of nickel corrosion in a constant corrosion solution. In addition, the area of the exposed nickel layer, which is determined by the number and size of the micropores, determines the rate of nickel dissolution.
A very good correlation with CASS test results of chromium(III) processes was achieved by adding a conventional wetting agent (as used in acid electrolytes) to the CASS test solution to avoid gas bubbles. The measuring time is 4 minutes with a voltage of 500 mV applied, with the workpiece being anodically connected. The measurement itself can be carried out using various methods. The Fuhrmann measuring cell, the couloscope measuring cell and a beaker set-up as in the Dubpernell test are suitable. The Fuhrmann copper ring or the Dubpernell copper electrodes serve as the cathode. In a series of tests, it was found that voltages < 300 mV are not sufficient and voltages > 800 mV lead to poorer correspondence of the corrosion images after simulation and CASS test. The current density acting on the system is now determined by the number of micropores, the potential of the chrome surface and the type of passivation. These three factors also primarily determine the corrosion result after the CASS test. In an experiment with very different solid contents in the microporous nickel electrolyte, the method was compared with existing pore counting methods. The problem that the usual test methods often count too many pores does not appear to exist with the new method (Fig. 1).
|
Pores |
passivation |
active sites /cm2 |
simulation pores / cm2 |
µm |
µm |
µm |
µm |
Pot. Differ. |
Pot. Differ. |
L*a*b*- |
||
|
little |
without |
4764 |
2978 |
0,19 |
2,1 |
10,2 |
13,7 |
39,5 |
108,8 |
84,83 |
-0,79 |
-1,06 |
|
little |
with |
4168 |
4168 |
0,18 |
2,2 |
13,0 |
14,8 |
55,1 |
117,7 |
84,90 |
-0,82 |
-0,63 |
|
little |
without |
5955 |
4764 |
0,20 |
2,5 |
10,4 |
6,5 |
31,5 |
112,5 |
85,07 |
-0,80 |
-0,95 |
|
little |
with |
4764 |
1787 |
0,20 |
2,4 |
11,5 |
5,6 |
43,7 |
115,2 |
84,85 |
-0,81 |
-0,72 |
|
little |
without |
5955 |
4764 |
0,22 |
2,3 |
10,2 |
16,3 |
41,1 |
110,1 |
85,11 |
-0,81 |
-0,81 |
|
little |
with |
3573 |
1800 |
0,19 |
2,3 |
11,9 |
5,3 |
39,7 |
120,6 |
84,54 |
-0,78 |
-0,77 |
|
much |
without |
20844 |
20248 |
0,22 |
2,6 |
10,5 |
16,0 |
43,1 |
114,9 |
85,13 |
-0,82 |
-0,83 |
|
much |
with |
47643 |
38710 |
0,24 |
2,7 |
14,9 |
8,7 |
41,5 |
128,6 |
84,87 |
-0,80 |
-0,45 |
|
much |
without |
26799 |
25012 |
0,22 |
2,7 |
10,7 |
14,4 |
30,4 |
114,5 |
85,07 |
-0,81 |
-0,81 |
|
much |
with |
14888 |
10124 |
0,23 |
2,5 |
13,0 |
18,8 |
44,8 |
119,4 |
84,90 |
-0,82 |
-0,47 |
|
much |
without |
9529 |
13101 |
0,24 |
2,7 |
14,3 |
7,6 |
40,9 |
125,8 |
85,06 |
-0,82 |
-0,74 |
|
much |
with |
8338 |
8338 |
0,23 |
2,2 |
10,4 |
5,0 |
36,8 |
117,8 |
84,83 |
-0,81 |
-0,56 |
Tab. 1: Results of the mini-DOE (mp Ni = microporous nickel; Gl. Ni = bright nickel; HG Ni = semi-bright nickel)
Results of the simulation method
After developing the optimum test conditions, a small DOE (design of experiments) was carried out as an initial feasibility study. This was limited to a bright chromium(III) deposition process based on sulphate. The only variants used were a different number of pores and the use of passivation. Each variant was tested on three ABS test specimens. The simulation took place first. This area was covered with adhesive tape and the entire test specimen was tested for 48 hours in the CASS test. The simulated area was then compared with the area immediately adjacent to it after the CASS test (maximum distance of 1 cm). This ensured that the number of micropores and potential differences on each test specimen were almost identical. The measurement results are shown in Table 1. The optical evaluation according to the CASS test was OK in all cases, the test specimens with more active sites looked slightly better than the test specimens with few active sites, as expected.
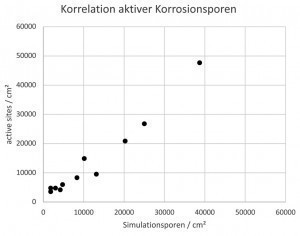 Fig. 2: Correlation of active sites after 48 h CASS and 4 minutes simulation, bright chromium(III) (TriMac BLUE MacDermid Enthone)
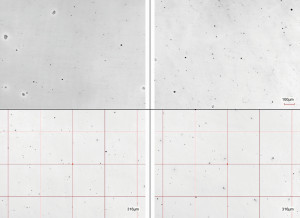
In contrast, the active sites were only determined after removal of the chromium layers under the microscope at 200x magnification. It was found that the number of active sites was almost identical after the CASS test and after 4 minutes of simulation (Fig. 2). The size, distribution and size distribution of the active sites were also very similar after the CASS test and simulation (Fig. 3).
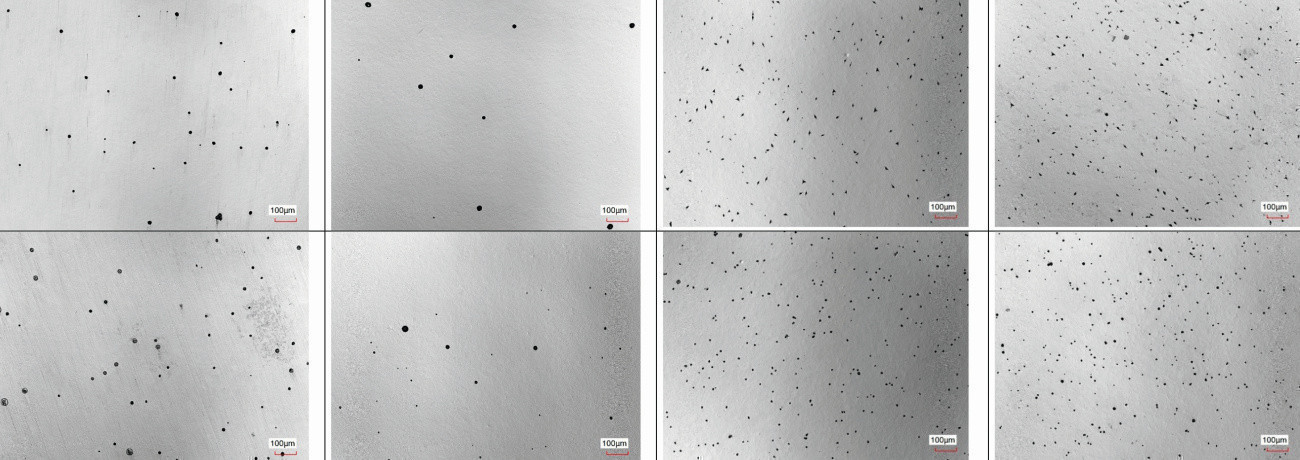 Fig. 3: 200x microscope images of the active sites after 4 minutes of simulation (top) and correspondingly after 48 h CASS test (bottom); after removal of the chromium layer
The corrosion current in the first 30 seconds of the simulation measurement was integrated and compared as µC (microcoulomb) with the pores counted per cm2 after 4 minutes of simulation (Fig. 4). In the case of the bright chromium(III) coating with TriMac BLUE, there is a clear correlation between the number of pores and the corrosion current. The passivated test specimens tended to have less corrosion current, but also tended to have fewer pores. The good correlation was actually surprising, as the counting of the pores itself contains a high potential for error and the number of pores does not necessarily correlate with the exposed nickel surface (the pore size can vary).
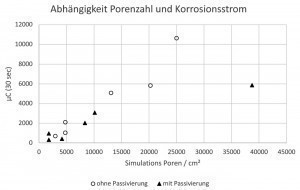 Fig. 4: Correlation between corrosion current and pore number in microporous bright chromium(III) coatings (TriMac BLUE MacDermid Enthone)
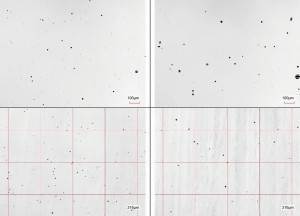
To substantiate the result, light (Fig. 5) and dark (Fig. 6) microporous chromium(III) components from production were subjected to the same test procedure. Here too, the corrosion pattern after the CASS test and simulation showed good agreement. The corrosion pattern after removal of the chromium layer differs slightly. After 4 minutes of simulation, the size distribution of the pores is more inhomogeneous than after the 48 h CASS test. On the other hand, the corrosion patterns directly after the respective tests are identical if the chrome layer has not yet been removed. The good agreement is shown in Figure 7.
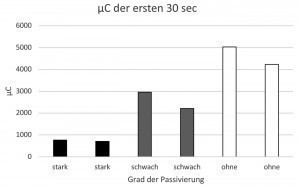
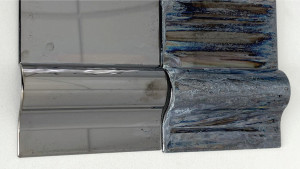
The comparison of the corrosion currents that flowed in the simulation for the dark chrome-plated components from series production with those of non-passivated dark chrome-plated components indicates a generally detectable difference (Fig. 8). At the same time, very different damage patterns are registered after 480 h of NSS testing (Fig. 9). The white spots originate from corrosion products of the nickel layers. As dark chrome layers are generally much more noble than pure light chrome layers, the underlying nickel layers are subject to significantly higher corrosion pressure, so that such coating systems do not normally pass the NSS test (sometimes up to 1000 h are required) without additional passivation.
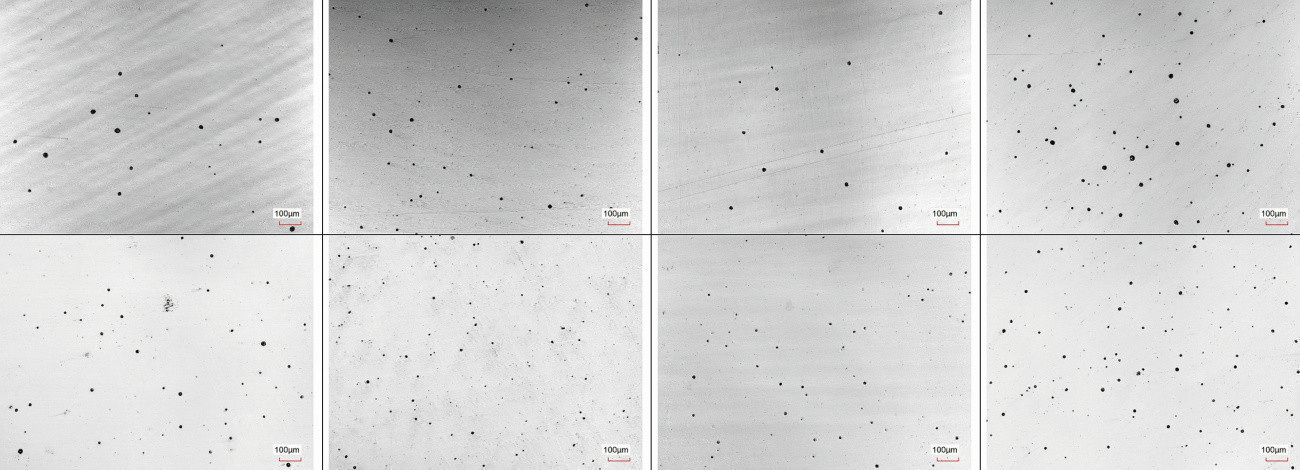 Fig. 7: 200x microscope images of corrosion after 4 min simulation (top) after 48 h CASS (bottom) of TriMac Eclipse components from production; before removal of the chrome layer
Summary and outlook
It was shown that the simulation method can quite reliably predict the corrosion pattern after 48 h CASS test with two different chrome surfaces (light and dark). The use of the CASS test solution in combination with a suitable constant voltage is considered to be the reason for the good correlation. If the method becomes established, production monitoring could be improved and any necessary optimizations could be initiated much faster than before. The simulation provides an image of the CASS test result in just a few minutes, which is generally only available after 72 hours (including 24 hours of storage).
In addition, it was shown that the simulation also provides values on the corrosion current. In the case of the dark chrome layers, which are particularly problematic in the NSS test (usually 480 h) due to their high resting potential, a correlation was found between the damage pattern after the NSS test and the amount of current that flowed as corrosion current in the simulation in the first 30 seconds. It was possible to prove that a specially developed chromium(VI)-free passivation has similarly good passivating properties as a chromium(VI)-containing passivation. Further series of tests are being carried out on this subject.
Further tests will attempt to apply the simulation method to a broader spectrum of chromium surfaces. In a 5-factor DOE, the influences of potential difference between microporous nickel and bright nickel, number of micropores, chromium layer thickness, with/without passivation and bright/dark chromium coatings are specifically tested. The experiment is then extended to conventional chromium(VI) processes and various chloride/sulphate chromium(III) processes with different passivations.
Literature
[1]DIN 53100, Metallic coatings - Electroplated
Nickel-chromium and copper-nickel-chromium coatings on plastics
[2]DIN EN ISO 9227, Corrosion tests in artificial
atmospheres - Salt spray tests
[3]Fuhrmann, A.; Möbius A.: Porentest - Improved method for determining the number of pores in microporous chromium-plated components, Metalloberfläche 56, 9 (2002), 68-71
[4]Dubpernell, G.: Electrodeposition of Chromium from
Chromic Acid Solution, Pergamon Press, New York (1977)
[5]ASTM B604 91:2015, Standard Specification for Decorative Electroplated Coatings of Copper Plus Nickel Plus
Chromium on Plastics, Appendix 4, ASTM International, West Conshohocken, PA, 2015, www.astm.org[6]GMW 14668-Sep.2015
[7]Nissan E-M4063; ASTM B0995-15AR21 - Standard Test
Method for Chloride Resistance Test for Chromium
Electroplated Parts (Russian Mud Test)
[8]Fechner, M.; Gruber, B.; Gerhold, S.; Wachter, P.; Hartmann, P.: Active sites in decorative chromium-plated automotive exterior parts (Part 3) - Electrochemical method for the accelerated determination of corrosion-active pores and cracks in decorative nickel-chromium coatings, Galvanotechnik 12/2017, 2402-2408


