The abrasive throughput is an important process parameter in the decoating of steel substrates by blasting with solid abrasives. The article describes statistical investigations on the influence of four factors (nozzle diameter, static air pressure, valve opening degree and abrasive grain size) on the abrasive throughput of two abrasive types (copper slag, cast steel). Some factors showed statistically significant influences on both types of abrasive, while other factors were statistically insignificant. Regression models were developed for the abrasive types, which were used to determine abrasive throughputs. A standardized quadratic regression model proved to be suitable for copper slag. For the heavier cast steel, a linear 3-parameter regression model provided sufficiently accurate values.
1 Introduction
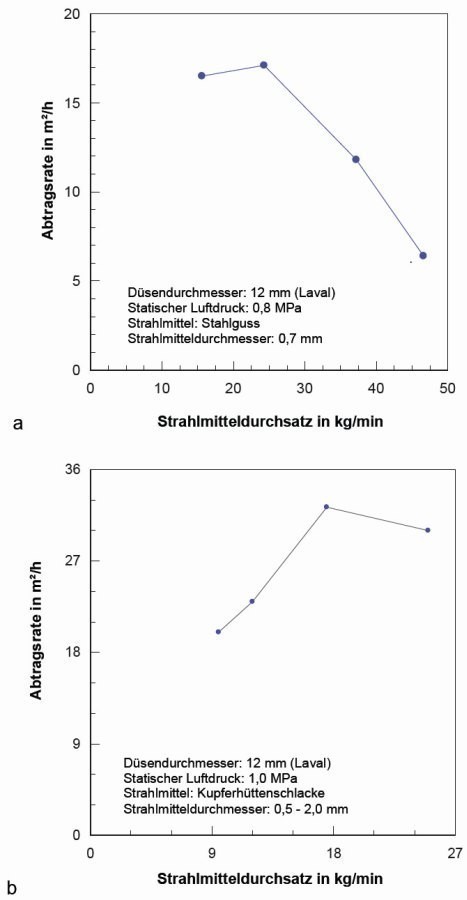
The abrasive flow rate is one of the most important parameters of blasting with solid abrasives [12, 13], and the optimization of this process parameter contributes significantly to increasing the effectiveness of blasting processes. It is known from studies on the use of blasting with solid abrasives for decoating [6-8, 13, 17] and for production-related material processing [11, 12] that optimum values for the abrasive throughput exist. Figure 1 shows two examples of the removal of organic anti-corrosion coatings from a steel substrate. In both cases, there is an optimum value for the abrasive flow rate at which the highest surface performance is achieved: 25 kg/min for the metallic abrasive and 17 kg/min for the mineral abrasive. The abrasive throughput in a compressed air system depends on a number of process and material parameters, in particular static air pressure, nozzle diameter, abrasive size and density and metering valve configuration [1, 2, 10, 17]. The aim of the investigations described in the article was to evaluate relevant influencing parameters and to model the dosing process on the basis of statistical investigations.
 Fig. 1: Relationship between removal rate and abrasive throughput. Coating: 2 layers of epoxy (2 x 180 µm), steel substrate preparation: Sa 2½ (see Momber, 2008). Maximum removal rate values are obtained at an abrasive flow rate of 25 kg/min (cast steel) and 18 kg/min (copper slag)
2 Test setup
The test setup is shown in Figure 2. The abrasive container was of the type "Taifun 8000"; it was equipped with a pneumatically controlled abrasive metering valve "ADV 80". The fully open valve was defined as valve opening degree "100 %", while the fully closed valve was defined as valve opening degree "0 %". The abrasive flow rate was determined as the quotient of abrasive mass and measuring time:
Eq. <1>
In the equation, ṁs is the abrasive flow rate in kg/min,MS is the measured abrasive mass in kg, and tM is the measuring time in minutes. The abrasive mass was measured using an electronic scale with an accuracy of ±100g. The measurement duration was one minute per measurement, whereby three measurements were carried out per parameter combination. The following process and material parameters were varied: Metering valve opening degree, static air pressure, nozzle diameter and abrasive grain size. The setting values/factors are listed in Table 1. The characteristic values for the non-metallic abrasive used (copper slag) can be found in Table 2 and the characteristic values for the metallic abrasive used (cast steel) can be found in Table 3.
|
Factor |
Unit |
Level |
Level |
|
1) Measured at the abrasive container inlet; 2) Divergent-convergent (Laval) |
|||
|
Static air pressure1) |
MPa |
0,6; 0,8; 1,0 |
0,6; 0,8; 1,0 |
|
Nozzle diameter2) |
mm |
8; 10; 12 |
8; 10; 12 |
|
Valve opening degree |
% |
40; 50; 75; 100 |
30; 40; 50; 75; 100 |
|
Blasting medium diameter |
mm | 2,6 |
0,4; 0,6 |
|
Characteristic values |
Unit |
Range |
|
1) According to ISO 11124-4 |
||
|
Type |
- |
Copper slag1) |
|
Grain size |
mm |
0.5 to 2.0 |
|
Grain shape |
- | angular |
|
Material density |
kg/m3 |
3.700 |
|
Bulk density |
kg/m3 |
1.850 |
|
Hardness |
Mohs |
> 7 |
|
Characteristic value |
Unit |
Range |
|
1) According to ISO 11124-3; 2) According to the manufacturer's data sheet |
||
|
Type |
- |
Cast steel with high carbon content1) |
|
Composition |
% |
C≥0.85; Si≥0.8; 0.6≤Mn≤1.2; S≤0.05; P≤0.05 |
|
Grain size ranges2) |
mm |
Fine: 0.35 to 1.18 > 1.00 mm (5 %) > 0.60 mm (55 %) > 0.35 mm (100 %) |
|
mm |
Coarse: 0.18 to 0.85 > 0.71 mm (5 %) > 0.60 mm (20 %) > 0.42 mm (50 %) > 0.30 mm (70 %) > 0.18 mm (100 %) |
|
|
Grain shape |
- |
angular |
|
Material density |
kg/m3 |
7.600 |
|
Bulk density |
kg/m3 |
4.500 |
| Hardness | HRc | 65,2 |
3 Statistical investigations
The following relationship was used as the basis for the statistical tests:
Eq. <2>
Here, p (static air pressure), dN (nozzle diameter), wV (valve opening degree) and dP (abrasive diameter) are the factors, and ṁs (abrasive flow rate) is the target characteristic value. A full-factorial test plan was created [19]. First, the residual parameters were determined in order to check the random nature of the test sequences. Finally, the results were evaluated using ANOVA (Analysis of Variance) to determine the influence of each factor and factor combinations on the test results (target parameter). The analyses were based on a significance level P = 0.05 (confidence level 95 %). The influence of a factor or factor combination is therefore insignificant for P > 0.05 [5]. The following characteristic values were determined for the respective factors/factor combinations: Degree of freedom, error sum of squares, mean statistical error, F-value and P-value [5]. The relationships were then modeled using regression analyses [16].
4 Results
4.1 Results of the abrasive throughput measurements
The results of the measurements for both abrasive types showed that the abrasive throughput increased when the values for static air pressure, nozzle diameter, valve opening degree increased and when the value for the abrasive grain size (cast steel) decreased. The results were in qualitative agreement with the findings of other authors [4, 10, 20].
For the mass flow rate of comparatively coarse particles (less than 3 % smaller than 250 µm) conveyed through a rectangular cross-section, the following equation can be applied [3, 18]:
Eq. <3>
In the equation, ρP is the abrasive bulk density, L is the length of the metering opening, W is the width of the metering opening, dP is the abrasive size and k=2.4 is an abrasive coefficient for angular abrasive [18]. The factors static air pressure and nozzle diameter are not included in equation <3> . An extension can be made as follows (with W=vW):
Eq. <4>
|
Exponent |
Metallic blasting abrasive |
Non-metallic blasting abrasive |
| A | 1.0 | 1.0 |
| B | 2.0 | 1.52 |
| C | 1.2 | 1.48 |
The exponents A, B and C are listed in Table 4 . The linear relationship between static air pressure and abrasive flow rate (A=1.0) confirms results [10] for non-metallic abrasive (corundum) and [14] for metallic abrasive (steel shot). While the exponent A was independent of the abrasive type, the exponents B and C were determined by the abrasive type. If values for static air pressure or nozzle diameter increase in a compressed air blasting system, the air flow rate increases according to the following laws [13]:
Eq. <5>
In the equations, ![]() is the air volume flow. Since, according to the law of continuity, the air volume flow in a system at a given static air pressure determines the air velocity [13], and the air velocity in turn determines the conveying velocity for abrasive, a general relationship of the following form can be predicted:
is the air volume flow. Since, according to the law of continuity, the air volume flow in a system at a given static air pressure determines the air velocity [13], and the air velocity in turn determines the conveying velocity for abrasive, a general relationship of the following form can be predicted:
Eq. <6>
In the equation, vP is the abrasive velocity in the compressed air system. A corresponding relationship is reported in [15], which determined an exponent D = 1.2.
The influence of the bulk density on the abrasive throughput in equation <4> was confirmed, at least qualitatively, by comparing the results of the two types of abrasive. The use of the considerably heavier cast steel resulted in a significant increase in the abrasive throughput. However, the grain sizes of the two types of abrasive were not identical.
4.2 Results of the statistical investigations
4.2.1 Residual analysis
The random character of the measurement results was confirmed for both types of abrasive on the basis of the residual analyses. The abrasive throughputs were normally distributed, no outliers were generated (residual versus fit), and the results did not follow a temporal trend (residual versus order). Systematic errors could therefore be excluded for both types of abrasive, and statistical methods could be used to evaluate the results.
4.2.2 Metallic abrasive
The ANOVA results for the metallic abrasive are shown in Table 5 . They showed that valve orifice size and nozzle diameter exerted extremely statistically significant influences (P < 0.001) on abrasive throughput, while the influences of static air pressure and abrasive grain size were statistically insignificant. Significant interactions between the factors could not be detected for any of the factors.
|
source |
Degrees of freedom |
Sum of squares |
Mean square |
F-test |
P value1) |
|
1) P > 0.05 insignificant; P < 0.01 very significant; P < 0.001 extremely significant [5] |
|||||
|
Model |
17 |
10.343,4 |
608,4 | 34,70 |
0,000 |
|
Linear |
|||||
|
Nozzle diameter |
2 |
2.467,10 |
556,90 | 31,70 |
0,000 |
|
Air pressure |
2 | 427,80 | 52,60 | 3,00 | 0,061 |
|
Valve opening |
4 |
7.187,50 |
1.545,4 |
88,10 |
0,000 |
|
Grain size |
1 | 36,00 | 34,30 | 1,95 | 0,0169 |
|
2-Way Interactions |
|||||
|
Nozzle diameter*air pressure |
4 | 126,00 | 30,40 | 1,74 | 0,160 |
|
Nozzle diameter*Grain size |
2 | 94,10 | 47,60 | 2,71 | 0,078 |
|
Air pressure*grain size |
2 | 4,90 | 2,50 | 0,14 | 0,869 |
|
Error |
42 | 736,80 | 17,50 | ||
|
total |
59 | 11.080,20 | |||
4.2.3 Non-metallic blasting abrasive
The ANOVA results for the non-metallic abrasive are shown in Table 6 . They showed that only the valve opening degree had a statistically significant influence (P < 0.05). With regard to the factor interactions, the linear combination of "dD*vW" showed a very significant correlation (P < 0.01). For the quadratic combination, there was an extremely significant statistical correlation for the combination "vW*vW" (P < 0.001).
|
Source |
Degrees of freedom |
Sum of squares |
Mean square |
F-test |
P value1) |
|
1) P > 0.05 insignificant; P < 0.01 very significant; P < 0.001 extremely significant [5] |
|||||
|
Model |
9 | 1.118,20 | 124,20 | 42,36 | 0,000 |
|
Linear |
|||||
|
Nozzle diameter |
1 | 0,02 | 0,018 | 0,01 | 0,939 |
|
Air pressure |
1 | 0,24 | 0,243 | 0,08 | 0,776 |
|
Valve opening |
1 | 16,24 | 261,70 | 84,10 | 0,028 |
|
2-Way Interactions |
|||||
|
Nozzle diameter*air pressure |
1 | 3,35 | 3,35 | 1,14 | 0,297 |
|
Nozzle diameter* |
1 | 27,13 | 27,13 | 9,25 | 0,006 |
|
Air pressure*Valve opening |
1 | 0,94 | 0,94 | 0,32 | 0,577 |
|
Square |
|||||
|
Nozzle diameter* |
1 | 0,47 | 0,47 | 0,16 | 0,693 |
|
Air pressure*Air pressure |
1 | 0,05 | 0,05 | 0,02 | 0,901 |
|
Valve opening*Valve opening |
1 | 45,76 | 45,76 | 15,6 | 0,001 |
|
Error |
22 | 64,53 | 2,933 | ||
|
total |
31 | 1.182,80 | |||
4.3 Regression equations
4.3.1 Metallic abrasive
The results were further analyzed using regression equations. The results for the metallic abrasive were analyzed using three linear regression equations; in detail:
2-parameter regression:
Eq. <7>
3-parameter regression:
Eq. <8>
4-parameter regression:
Eq. <9>
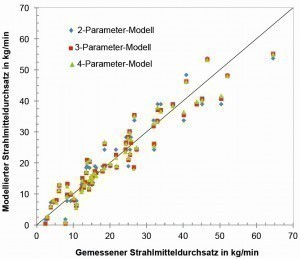
 Fig. 3: Correlation between abrasive flow rates determined using regression models and measured abrasive flow rates for the metallic abrasive (cast steel)
The regression parameters aij can be found in Table 7. A further refinement of the regressions was carried out using two methods, namely "Mallows'-CP" and "PRESS" (predicted residual error sum of squares) [16]. The results of the calculations in Table 8 and Figure 3 showed that a 3-parameter regression without consideration of the abrasive grain size provided sufficiently accurate values. The results of the regression calculations are plotted against the measured values for the abrasive throughput in Figure 3 .
|
Coefficient |
Value |
SE-C1) |
t-value |
P-value2) |
VIF3) |
|
2-parameter regression |
|||||
|
a20 |
-37,20 |
3,76 |
-9,90 |
0,000 |
- |
|
a21 |
0,59 |
0,031 |
19,24 |
0,000 |
1,03 |
|
a22 |
2,66 |
0,36 |
7,37 |
0,000 |
1,03 |
|
3-parameter regression |
|||||
|
a30 |
-43,40 |
4,33 |
-10,04 |
0,000 |
- |
|
a31 |
2,63 |
0,34 |
7,63 |
0,000 |
1,04 |
|
a32 |
0,58 |
0,029 |
29,77 |
0,000 |
1,05 |
|
a33 |
8,97 |
3,47 |
2,58 |
0,012 |
1,02 |
|
4-parameter regression |
|||||
|
a40 |
-39,50 |
5,40 |
-7,33 |
0,000 |
- |
|
a41 |
2,59 |
0,34 |
7,49 |
0,000 |
1,05 |
|
a42 |
0,59 |
0,031 |
19,18 |
0,000 |
1,17 |
|
a43 |
9,10 |
3,46 |
2,63 |
0,011 |
1,02 |
|
a44 |
-6,99 |
5,83 |
-1,20 |
0,236 |
1,12 |
|
1) Standard deviation in % |
|||||
|
Model |
Evaluation parameter |
||||
|
R2 |
R2Adj |
PRESS |
Mallows'-Cp |
S1) |
|
|
2-parameter |
89,6 | 89,3 | 1.317 | 9,2 | 4,5 |
|
3-parameter |
90,7 | 90,2 | 1.215 | 4,4 | 4,3 |
|
4-parameter |
91,0 | 90,3 | 1.227 | 5,0 | 4,2 |
4.3.2 Non-metallic abrasive
The results were further processed using a quadratic regression equation (Eq. <10>) .
Eq. <10>
Eq. <11>
Although the standard deviation (1.7 %) was low and the regression coefficient (RAdj2 = 0.92) was satisfactory, the high values for VIF (42 to 344) showed that the regression had a high degree of multicolinearity. A critical upper value for VIF is 10 [9]. Multicolinearity can, among other things, mask significant factors and lead to changes in the sign of regression constants. Standardization of the variables can reduce multicolinearity. The results of a corresponding procedure are listed in Table 9 .
|
Coefficient |
Value (coded) |
Value (uncoded) |
SE-C1) |
T-value |
P-value2) |
VIF3) |
|
1) Standard deviation coefficient = ratio of mean value/standard deviation 2) P > 0.05 insignificant; P < 0.01 very significant; P < 0.001 extremely significant [5] 3) Variance inflation factor; should not exceed the value VIF = 10 [9] 4) Standard deviation |
||||||
|
a0 |
13,07 | -19,18 | 0,518 | 25,22 | 0,000 | - |
|
a1 (dN) |
2,21 | -0,374 | 0,304 | 7,26 | 0,000 | 1.06 |
|
a2 (p) |
0,865 | 5,38 | 0,304 | 2,84 | 0,009 | 1.06 |
|
a3 (wV) |
5,830 | 0,439 | 0,330 | 17,66 | 0,000 | 1.24 |
|
a6 (dN-wV) |
0,986 | -0,0034 | 0,305 | 3,23 | 0,003 | 1.01 |
|
a9 (wV-wV) |
-1,86 | 0,0263 | 0,443 | -4,19 | 0,000 | 1.28 |
|
S4) |
1,65 % | |||||
|
R2Adj |
92,89 % | |||||
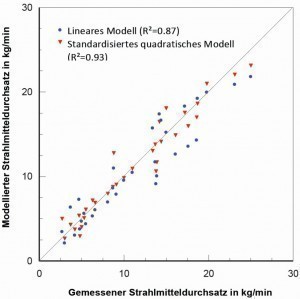
 Fig. 4: Correlation between abrasive throughputs determined using regression models and measured abrasive throughputs for the non-metallic abrasive (copper slag)
The significantly reduced, but more precise, modified regression equation can be seen in equation <11> . Standard deviation and regression coefficient showed slightly improved values. The VIF values were significantly reduced (<<10) and had approached an ideal value of 1.0. It was also found that the nozzle diameter and valve opening ratio factors and the quadratic interaction vW*vW were extremely significant. These significances had been masked due to the multicolinearity. The possibility of a change of sign in the regression constants due to multicolinearity, as indicated above, was confirmed. The results of the regression calculations are plotted against the measured values for the abrasive throughput in Figure 4 .
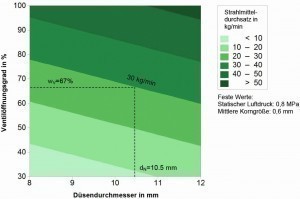
 Fig. 5: 2-dimensional simulation of the abrasive flow rate for cast steel. Variable parameters: nozzle diameter (dN in mm) and valve opening (wV in %); fixed parameters: static air pressure (p = 0.8 MPa) and average abrasive grain size (dP = 0.6 mm). Example: dN = 10.5 mm, wV = 67 % ®blasting media throughput = 30 kg/min
Summary
The abrasive flow rate is an important process parameter in the decoating of steel substrates by means of blasting with solid abrasives. The article describes statistical investigations on the influence of four factors (nozzle diameter, static air pressure, valve opening degree and abrasive grain size) on the abrasive throughput of two abrasives (copper slag, cast steel). Some factors showed statistically significant influences on both types of abrasive, while other factors were statistically insignificant. Regression models were developed for both types of abrasive, which were used to determine abrasive throughputs. A standardized quadratic regression model proved to be suitable for copper slag. For the heavier cast steel, a linear 3-parameter regression model provided sufficiently accurate values. The regression models can be used to set optimal values for the abrasive throughput, an example of which is shown in Figure 5.
Acknowledgments
The statistical analysis was carried out by Dipl.-Ing. T. Marquardt, Muehlhan AG, Hamburg.
Literature
[1] Adlassing, K.; Jahn, W.: Die Eigenschaften von Strahlmitteln und Düsenwerkstoffen bei Druckluft-Strahlanlagen, Giesserei, 48 (1961) 618-622
[2] Bae, H.J.; Baek, J.J.; Lee, C.S.: Improvement of blasting productivity by optimizing blasting-related operation parameters, In: Conference PACE 2007, Dallas, TX, USA, 11-14 February (2007)
[3] Beverloo, W.A.; Leniger, H.A.; van de Velde, J.: The flow of granular solids through orifices, Chemical Engineering Science, 15 (1961) 260-269
[4] Brauer, H.: Grundlagen der Einphasen- und Mehrphasenströmungen, Verlag Sauerländer, Aarau, 1971
[5] Garcia-Diaz, A.; Phillips, D.T.: Principles of Experimental Design and Analysis, Chapman & Hall, London, 1994
[6] Hareux, D.; Riac. B.: A comparative study of air blasting using different abrasives, Corrosion Protection Materials, 5(1), (1968) 18-34
[7] Holt, S.; Austin, D.M.: How nozzle pressure and feed rate affect productivity of dry abrasive blasting, Journal of Protective Coatings and Linings, 18(10), (2001) 82-104
[8] Kambham, K.; Sangameswaran, S.; Datar, S.R.; Kura, B.: Copper slag: optimization of productivity and consumption for cleaner production in dry abrasive blasting, Journal of Cleaner Production, 15 (2007) 465-473
[9] Kutner, M.H.; Nachtsheim, C.J.; Neter, J.: Applied Linear Regression Models, 4th ed., McGraw-Hill, Irwin, 2004
[10] Mellali, M.; Grimaud, A.; Fauchais, P.: Parameter controlling the sand-blasting substrates for plasma spraying, In: Proceedings 7th International Thermal Spray Conference, Boston, MS, USA, June 20-24 (1994) 227-232
[11] Momber, A.W.: A generalized abrasive water jet cutting model, In: Proceedings of the 8th American Water Jet Conference, (1995) (ed. T.J. Labus), WJTA, St. Louis, Vol. 1, 359-371
[12] Momber, A.W.; Kovacevic. R.: Principles of Abrasive Water Jet Machining, Springer, London (1998)
[13] Momber, A.W.: Blast Cleaning Technology, Springer Publ., Heidelberg, (2008)
[14] Nadkarni, V.S.; Sharma, M.C.: Some aspects of mass flow control of shots in pneumatic systems, The Shot Peener, 10(3) (1996) 30-34
[15] Neelakantan, M.N.; Green, R.G.: The measurement and control of impact finishing processes, Journal of Physics E: Scientific Instruments, 15 (1982) 1332-1336
[16] Rawlings, J.O.; Pamtula, S.G.; Dickey, D.A.: Applied Regression Analysis: A Research Tool, 2nd ed., Springer, New York (1998)
[17] Remmelts, J.: Optimum conditions for blast cleaning of steel plate, British Corrosion Journal, 3(1968) 88-89
[18] Schulze, D.: Powder and Bulk Solids (Chapter 12), Springer-Verlag, Berlin-Heidelberg (2009)
[19] Siebertz, K.; van Bebber, D.; Holzkirchen, T.: Statistische Versuchsplanung, Springer-Verlag, Berlin-Heidelberg (2010)
[20] Tanaka, T.; Kawai. S.: Outflow of bulk solids from bunkers with a vertical wall and rectangular discharge opening, Aufbereitungs-Technik, 4(7) (1963) 282-286


