- 2nd and final part - transfer of the coating parameters, construction and testing of the test specimen
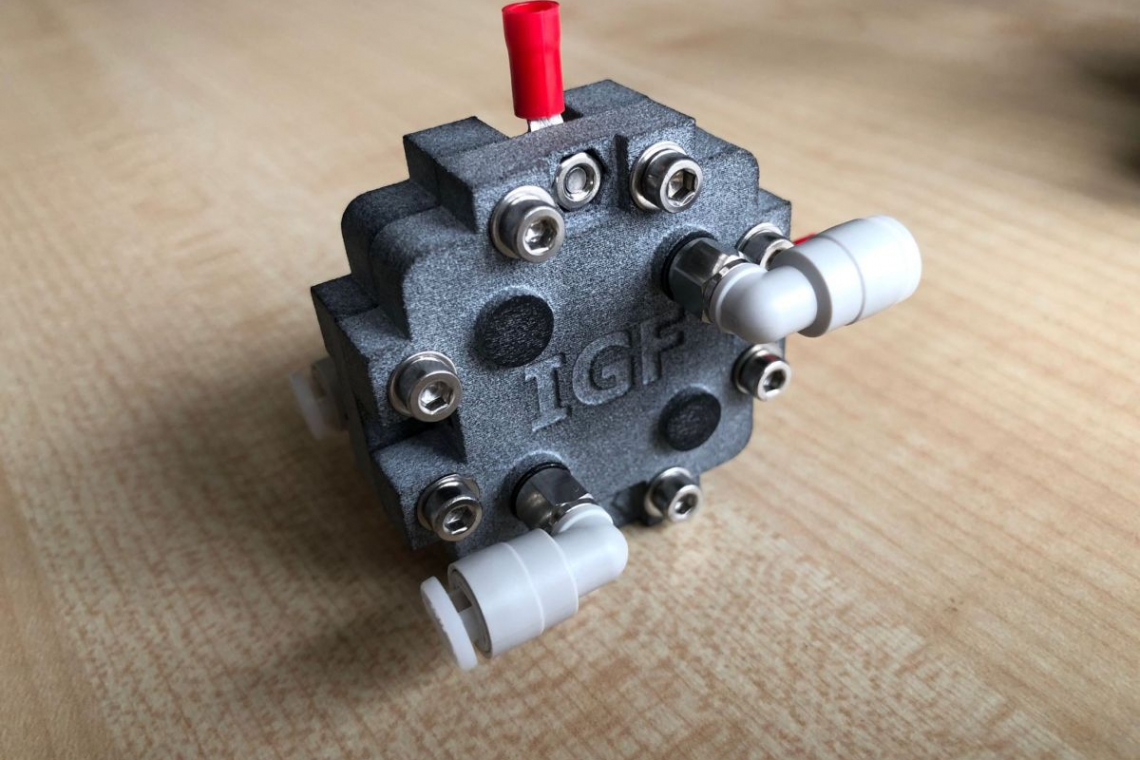
In a joint project, a sensor fuel cell was developed that can qualify material and monitor hydrogen systems. Its central components made of 3D-printed polyamide-12 (PA12) were functionalized using galvanic and electroless processes. A combination of chemical nickel deposition and subsequent galvanic copper, nickel and gold deposition was chosen for the coating. The coatings showed good adhesion to the plastic substrate, high conductivity and complete hydrogen impermeability.
Characterization of the different layer structures
In this chapter, the most promising combinations, chemNi/chemAu and chemNi/galvCu/galvNi/galvAu, are examined in detail. At the beginning, the conductivity measurements are presented. This is followed by measurements of hydrogen permeability in the Devanathan cell. Finally, the corrosion resistance of the coating systems is examined. The aim is to identify the most suitable system for transfer to the final test specimen geo-metry.
Conductivity measurements
Both the surface resistance and the contact resistance were determined for the various systems. The surface resistance describes the resistance that the current experiences as it passes through the surface of a material. Contact resistance, on the other hand, occurs at the junctions between two conductive materials that are in contact with each other.
In principle, there are clear differences between chemically and electrochemically produced layers when measuring conductivity (surface resistance). While the sheet resistance for different chemical samples is between 154 and 246 mΩ, it varies between 0.5 and 12.9 mΩ for different galvanic layer sequences. The sheet resistance basically depends on various factors, whereby in this case the layer thickness probably has the most decisive influence, as this is limited in the chemical coating. Thinner layers tend to have a higher resistance. The material of the sample also plays a significant role: copper has a significantly higher electrical conductivity than nickel. Galvanically deposited coatings also generally have a higher conductivity than those deposited without external current, as they are denser, more defect-free and structurally more uniform.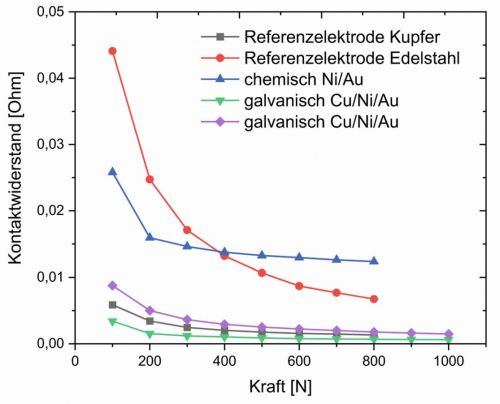 Fig. 8: Representation of the contact resistance of two reference samples (copper and stainless steel) and various samples with the developed sensor cell coatings (galvanic and chemical)
In principle, the measurements of the contact resistance show the same picture as the measurements of the sheet resistance. Figure 8 shows contact resistance measurements of two reference samples (stainless steel and copper) and various coatings. All samples show the characteristic curve of the contact resistance: The resistance decreases with increasing contact force, as microscopic deformations lead to an increase in the effective contact area.
Due to its excellent electrical conductivity, the copper reference electrode has a significantly lower contact resistance than the stainless steel reference material.
It can also be seen that the contact resistance of the chemically produced sample is significantly higher than that of the electrochemically produced samples.
The measurements show that the conductivity of purely chemically deposited layers is not sufficient for use as a coating material for the bipolar plates, which is why a combination of galvanic and chemical processes appears to be the most sensible approach for the final test specimen geometry. Based on the results of the conductivity measurements, a minimum layer thickness of 10 µm electroplated copper was specified for all samples.
Hydrogen permeability measurements
Hydrogen permeability measurements were carried out in a Devanathan cell. These measurements are important to show that the hydrogen in the fuel cell cannot diffuse through the layer stacks and thus escape, but is processed through the cell in a controlled manner. On the one hand, gas losses reduce the efficiency and economy of the fuel cell; on the other hand, escaping hydrogen in combination with oxygen can form an explosive gas mixture, which can pose an enormous safety risk.
For the investigations, the selected chemNi/chemAu and chemNi/galvCu/galvNi/galvAu layer stacks were deposited on a reference steel sheet and examined accordingly. The Devanathan cell consists of two chambers, which are separated from each other by the sample to be examined. In the first chamber, hydrogen is generated electrochemically, which then diffuses through the material. On the other side, the hydrogen is oxidized, generating an electric current. This current is directly proportional to the amount of hydrogen that has passed through and enables the hydrogen permeability of the material to be determined. An uncoated steel sheet is used as a reference. This allows direct conclusions to be drawn about the impermeability of the coating. Figure 9 shows the curves for measuring the hydrogen permeability. The current signal of the reference sheet shows a clear hydrogen permeability.
Even a purely chemical coating with Ni and Au is not sufficient to keep hydrogen out. In contrast, the sample chemNi/galvCu/galvNi/galvAu shows no hydrogen permeability during the measurement period.
Both the conductivity measurements and the hydrogen permeability measurements thus show the suitability of the chemNi/galvCu/galvNi/galvAu system.
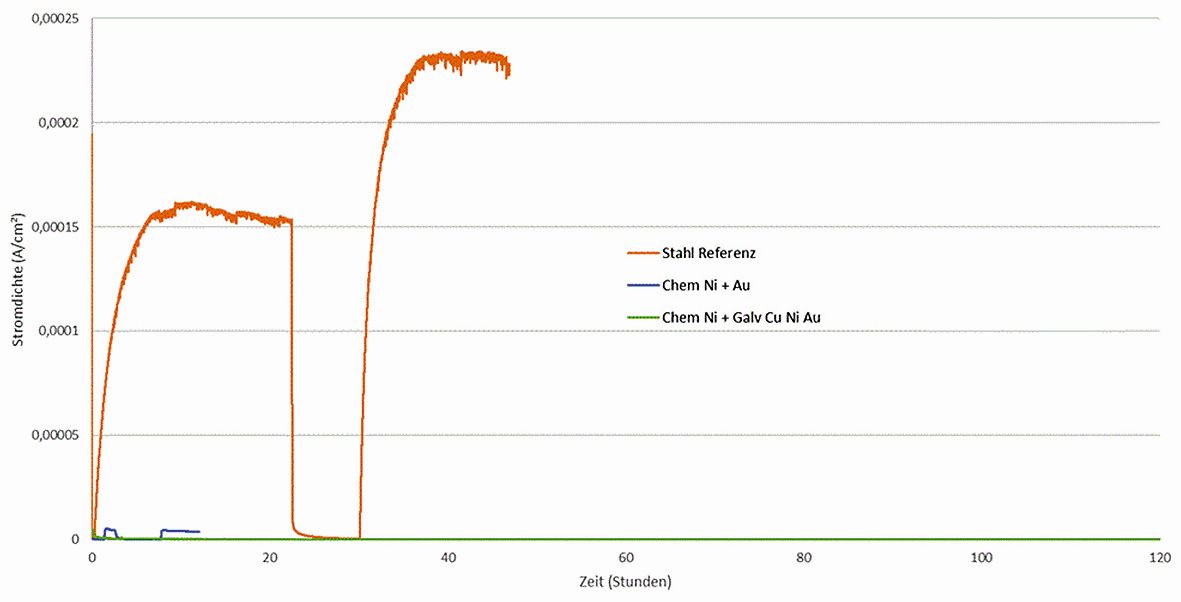 Fig. 9: Hydrogen permeability measurements in the Devanathan cell. The steel reference measurement and the selected layer stacks chemNi/chemAu and chemNi/galvCu/galvNi/galvAu are shown.
Corrosion measurements
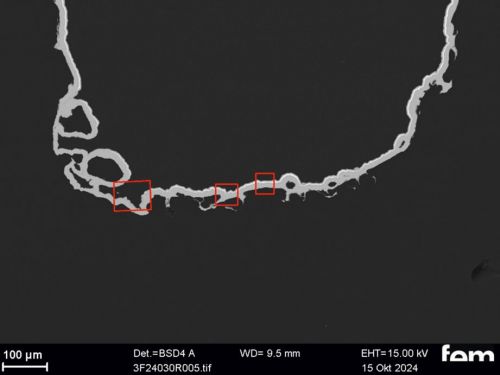
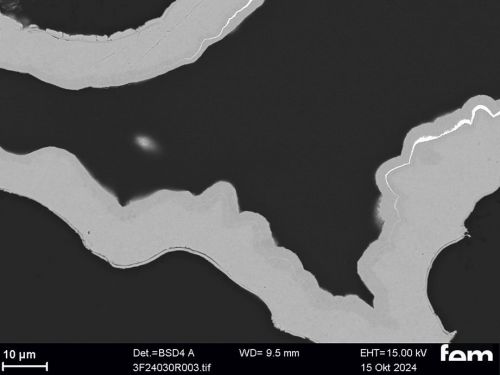
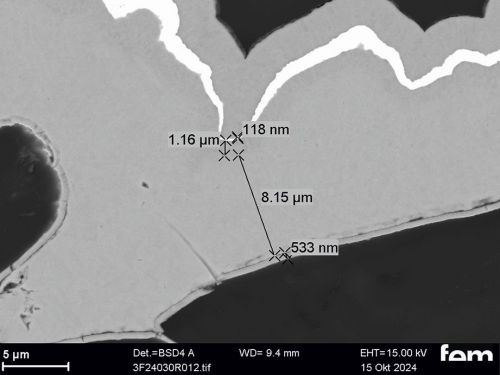
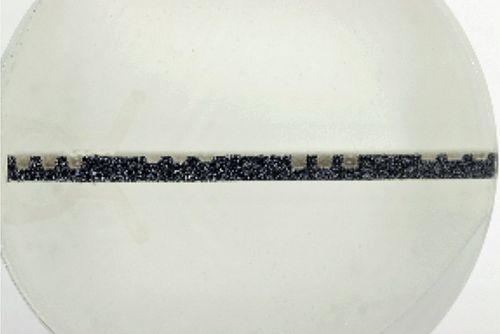
Corrosion measurements were carried out on the chemNi/galvCu/galvNi/galvAu system using the aggravated acetic salt spray test (AASS) DIN 9227 over 48 hours. Corrosion products on the samples show that the gold and nickel layers are too thin at certain points and that localized corrosion of the underlying copper occurs in some cases. To illustrate this, cross-sectional examinations of a coated PA12 sample with a flow-field design are shown in Figure 10.
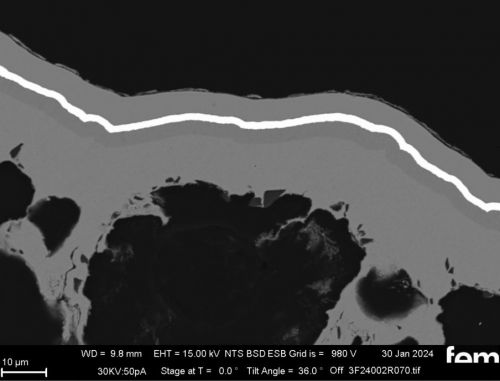
Figure 10 a) shows an overview of the cross-section surface under consideration. The areas marked in red are shown in detail from left to right in Figure 10 b) to d). In Figure 10 b) and c) it can be seen that the roughness of the printed PA12 surface leads locally to sharp-edged structures in which cavities form. In these areas, the scattering of the electrochemical nickel and gold electrolyte is insufficient, which leads to very thin layers locally. This makes the surface in these areas more susceptible to corrosion. Depending on the service life of the final sensor cell component, this could be a critical factor and make further optimization necessary. Figure 10 d), on the other hand, shows areas where the layers are dense.
(Fig. 10: Scanning electron micrographs of coated bipolar plates, layer thickness distributions (galv. Cu, galv. Ni, galv. Au + Ni protective layer), the area marked in red in a) is shown enlarged again in b), c) and d)))
Transfer of the optimized coating parameters to the final test specimen geometry
Finally, as part of the project, the optimized chemNi/galvCu/galvNi/galvAu coating system was transferred step by step to the final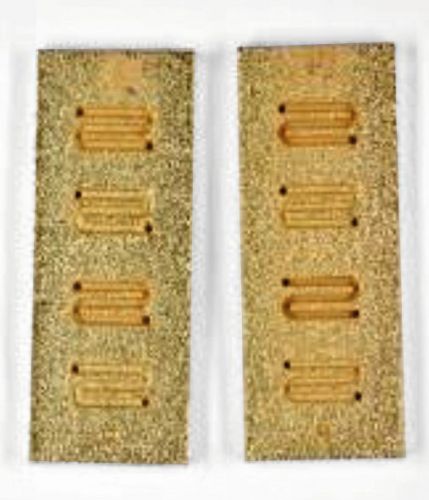 Fig. 11 b)
  Fig. 11 a)Specimen geometry. For this purpose, coating tests were first carried out on the test specimens shown in Figure 2 (see Galvanotechnik 7/2025, p. 843 ff.) to evaluate different channel and web properties. Finally, the coating tests were carried out on the 3D-printed shaping test specimens of the fuel cell shown in Figure 3 and Figure 4.
The initial aim was to achieve a homogeneous and uniform coating thickness by adjusting the coating durations of the various layers in the optimized coating sequence, even in areas of the flow field channels that are difficult to access. As a purely chemical coating is not an option due to the results presented above in the chapter on conductivity measurements and hydrogen permeability measurements, the channel walls must be slightly slanted for the galvanic coating. Figure 11 and Figure 12 show images of the optimized coating tests on the test specimens shown in Figure 2.
(Fig. 11: Coating tests on the test specimens shown in Fig. 2: a) uncoated b) coated with chemNi/galvCu/galvNi/galvAu (specimen size 50 mm × 20 mm × 2 mm CAD model))
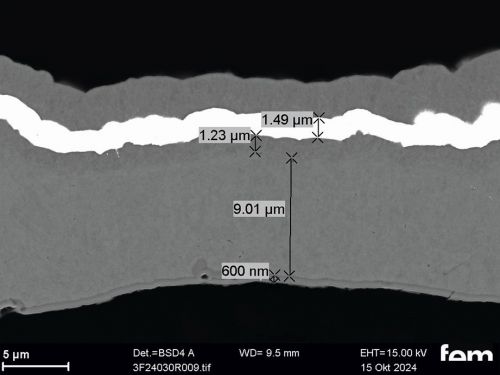
(Fig. 12: Cross-sectional examinations of the specimens coated with chemNi/galvCu/galvNi/galvAu shown in Figure 2 (specimen size 50 mm × 20 mm × 2 mm CAD model))
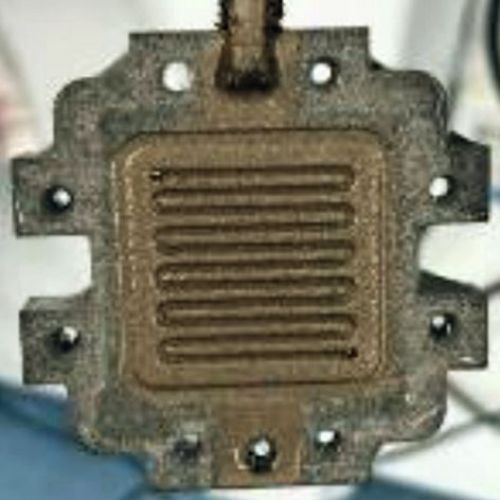
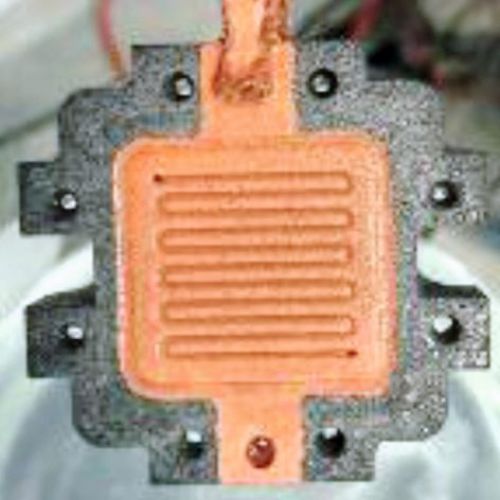
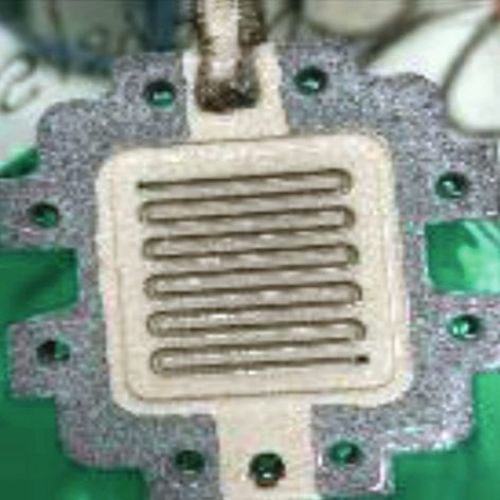
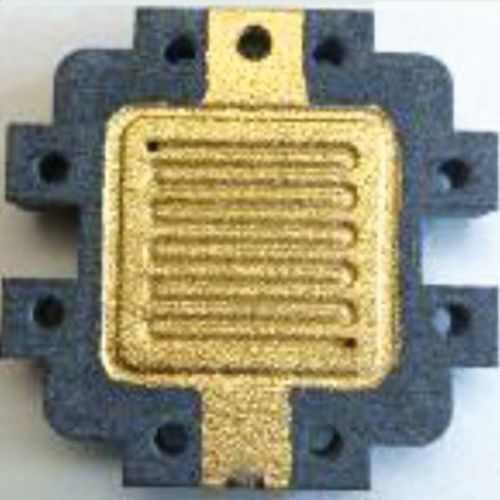
The coating tests were then transferred to the final test specimens. In order to avoid short circuits, it is essential to leave certain areas uncoated. The metallization must be limited exclusively to the contact surfaces and the active area within the flow field. For this reason, all other areas were carefully covered during the coating process. Figure 13 shows the coating process step by step. To ensure optimum coating adhesion, the masking was first removed (Fig. 13 b) after the initial metallization using electroless nickel (Fig. 13 a). This was followed by the electroplating of a copper layer (Fig. 13 c), followed by an electroplated nickel layer as a diffusion barrier (Fig. 13 d). The final step is an electroplated gold layer to improve contacting and corrosion resistance (Fig. 13 e).
(Fig. 13: Step-by-step illustration of the coating process of the 3D-printed test specimens with a) electroless nickel b) removal of the masking c) electroplated copper d) electroplated nickel and e) electroplated gold (CAD model for sample size see Fig. 3))
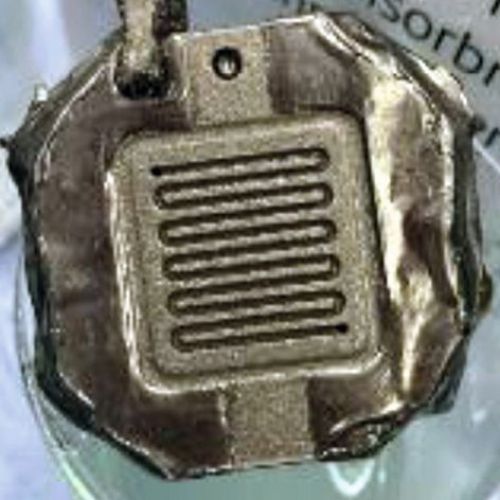
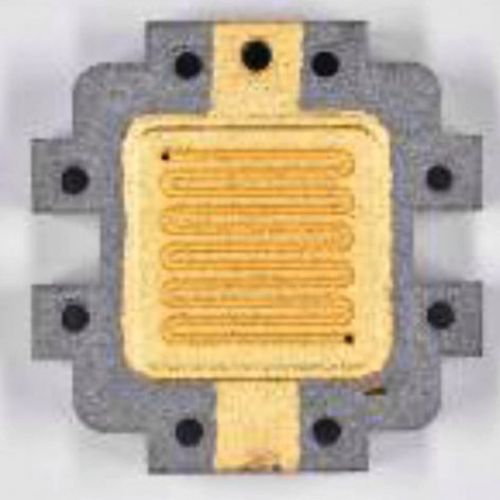
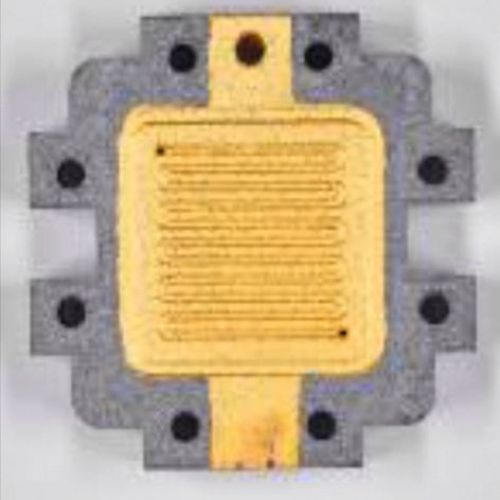
Figure 14 shows the final coated test specimens for a) the cathode and b) the anode side of the sensor cell. These bipolar plates were integrated into a sensor cell and characterized in the further course of the project.
(Fig. 14: final coated test specimens for the a) cathode side and b) anode side of the sensor cell (CAD model for sample size see Fig. 3))
Construction and testing of the sensor fuel cell
While the novel multi-component parts based on the manufacturing process to be developed represented the central development focus of the project, the other sensor cell components such as proton exchange membranes, gas diffusion layers and the connection periphery were procured according to the current state of the art and assembled in relation to the multi-component parts. Assembly aids for cell construction were also provided via 3D printing. A dispensed silicone seal completes the multi-component parts, which were then assembled into sensor cells. Finally, these were operated on a test stand, measured and prepared for material qualification tests based on emission chambers.
Membrane electrode assembly (MEA)
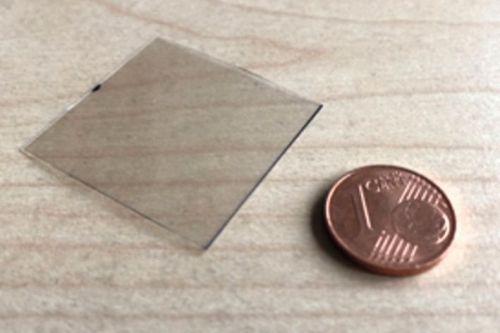
The proton exchange membrane for the sensor fuel cells is a NafionTM-HP membrane. This is available in rolls and was cut to the cell scale using cutting and punching tools. Corresponding templates were derived from the CAD models of the cells and manufactured from MJF PA12 using 3D printed products. Figure 15 a) shows a cut-to-size Nafion membrane in protective film.
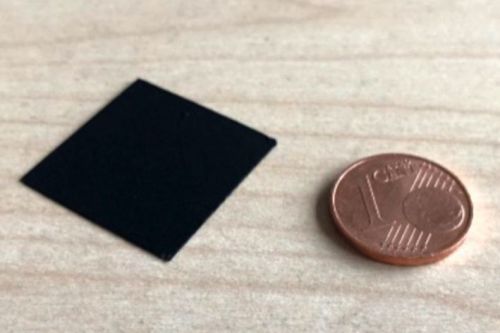
A Freudenberg gas diffusion layer (GDL), also in rolls, was procured directly with a microporous layer as GDS. This is type H23C8. The microporous layer was provided with a catalyst coating developed in-house by ZBT using ultrasonic spraying, thus upgrading the GDS to a gas diffusion electrode (GDE). It was then cut to sensor cell format again using a template derived from the CAD model and produced using 3D printing. The GDE of the sensor cell is shown in Figure 15 b).
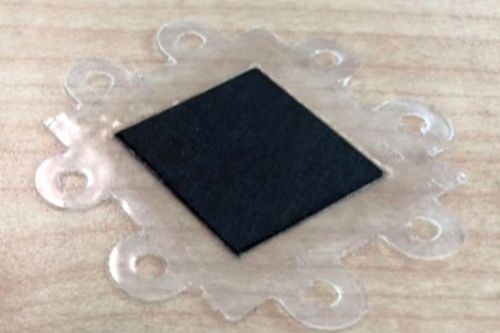
Due to the filigree properties of the thin Nafion membrane and the difficult handling under different humidity conditions, an edge reinforcement must be used for support. In terms of material, this is a conventional laminating film in sheet form. Two-dimensional data was derived from the three-dimensional data of a CAD model and the films were then cut to the required dimensions using a CNC-controlled milling machine and a drag knife. Figure 15 c) shows the assembled edge reinforcement.
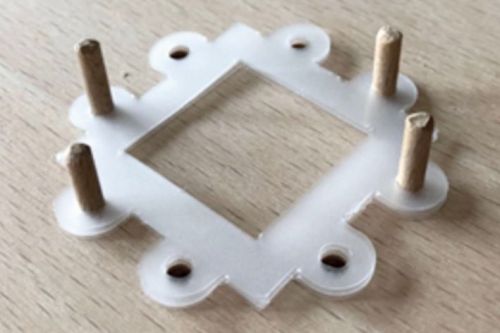
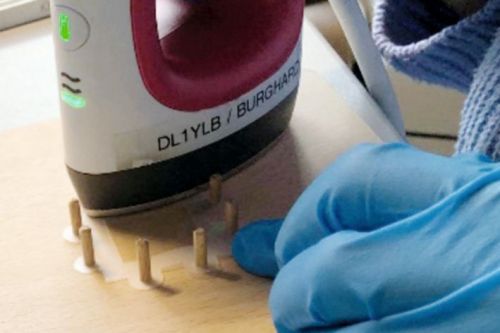
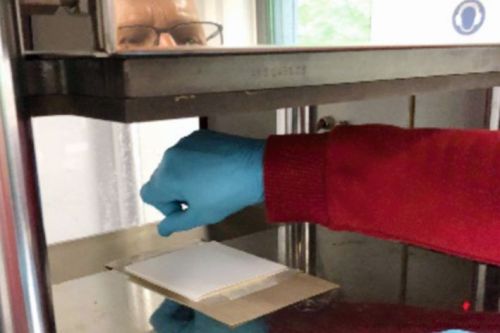
In the measurement tasks of sensor fuel cells within material qualification based on emission chambers, the MEAs are regularly replaced wear components. They must be easy to handle during cell assembly and were therefore joined and prepared in advance independently of this. The joining process consists of two parts. In the first step, in Figure 15 d), the edge reinforcement is pinned to a board via holes. The pins can be positioned individually so that the Nafion membrane can be pressed in sections with the edge reinforcement using a mini hot press. In the second step, the GDEs were positioned on both sides of the membrane and positioned over the damping structures within a full-surface hot press (Fig. 15 e)). The GDEs and membrane were then pressed at 140 °C under 5 kN pressure for one minute. Figure 15 f) shows a finished MEA of the sensor fuel cell.
(Fig. 15: Production of the MEA of the sensor cell)
Sealing
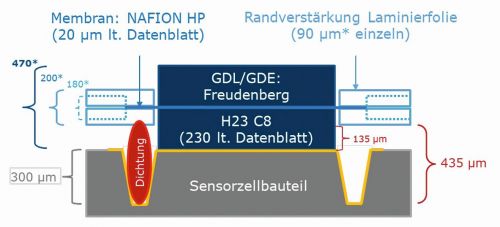
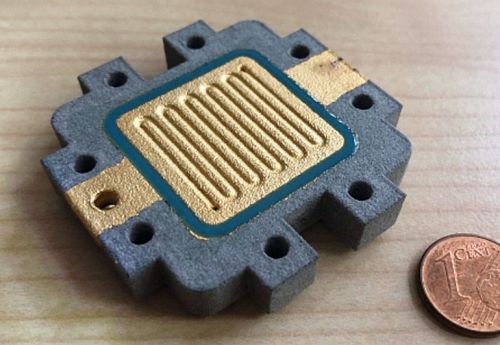
A sealing process was developed and used for the structural design between the MEA and the sensor cell component shown in Figure 16 a). This made it possible to provide the surfaces metallized by the cooperating research institutes with dispensable silicone seals suitable for fuel cells. To do this, the components to be sealed were first measured to determine the required height of the seal for the dispensing process. Using the intended sealing groove, the adhesive property of the seal could be made sufficiently firm to also enable reversible cell structures. Figure 16 b) shows the dispensed silicone seal on the metallized areas of a sensor cell component.
(Fig. 16 a) Assembly of MEA and sensor cell component in the context of the seal and b) dispensed silicone seal on the sensor cell component)
Assembly
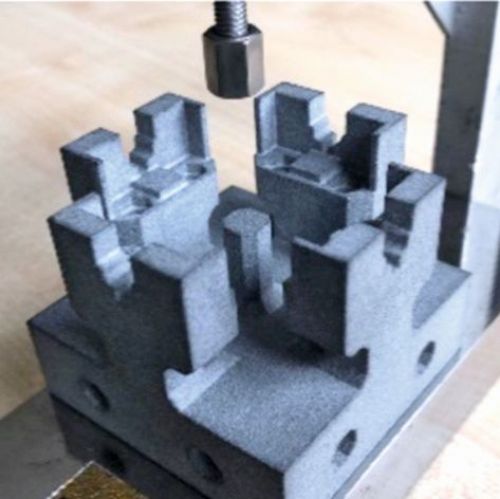
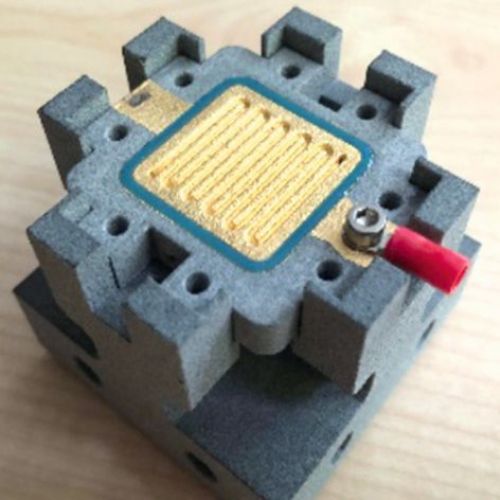
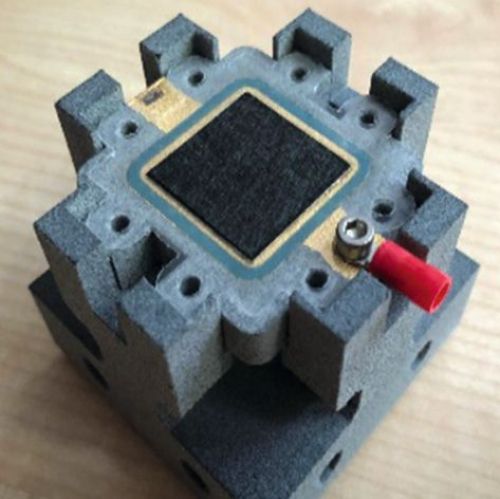
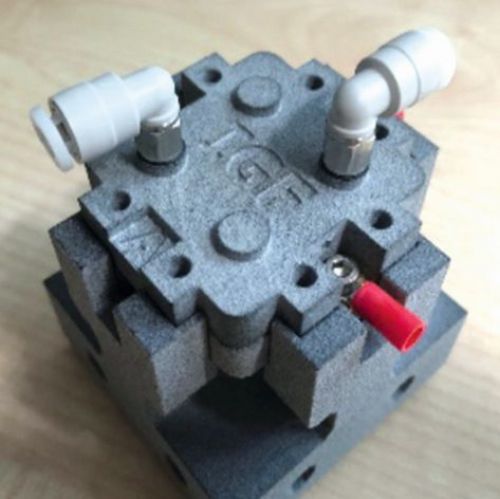
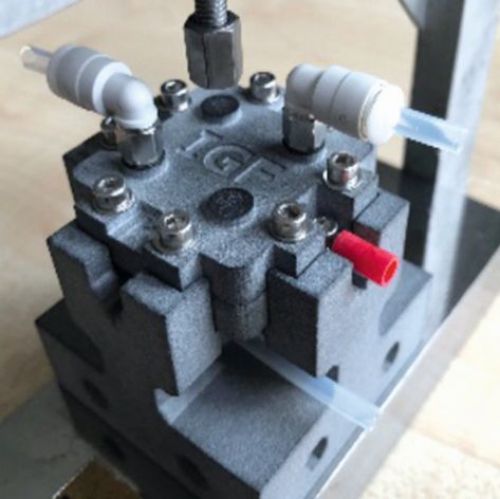
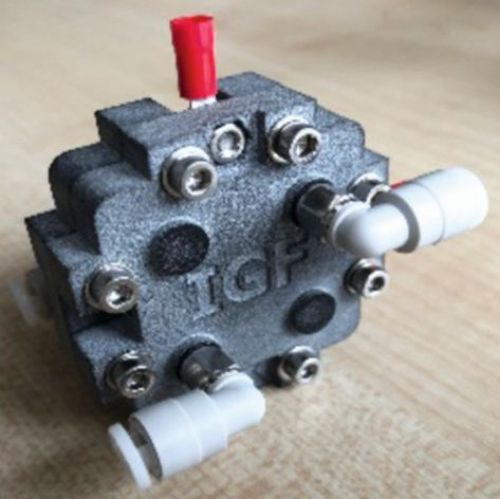
To assemble the sensor cell, an assembly aid was contoured and 3D-printed from PA12 using the multi-jet fusion process. A central element in the assembly was also an external device for tensioning, which enables defined contact pressures to be transferred to the sensor cell components by means of torque. In this way, the internal pressure drop can be measured to check whether and from what contact pressure the sensor cell seals reliably. At the same time, the internal cell resistance can also be measured and adjusted at any time in the context of the contact pressure. If the contact pressures are in the optimum range, they are permanently maintained for the sensor cell using M5 screws or adhesives. Alternatively, this external device can be used to completely dispense with the internal tensioning options. In this way, an assembly-friendly structure of the sensor cell is realized, which allows quick changes of MEAs as test specimens within the laboratory operation. Figure 17 a) shows the assembly aid in the external clamping device. Figure 17 b) - c) guide you through the assembly process and Figure 17 d) and f) show finished sensor cells for operation.
(Fig. 17 a) assembly aid, b) to d) assembly of the sensor cell and e) and f) ready-to-use sensor cells)
Test setup
An adapted test stand for the further development of micro fuel cell system components served as the operating and measuring workstation for testing the sensor fuel cells. This allows PEM fuel cells, purge valves, accumulators, hydrogen storage units and electronic components for control and regulation technology to be tested individually or in combination and optimized for system technology. The operating requirements of the sensor cells were used as the basis for the adjustments made to the test stand. This mainly involved the realization of active operation on the cathode side via mass flow controllers (MFC). These supply the sensor cell directly with controllable volume flows of air. Hydrogen flow rates can also be provided by MFCs for the anode-side supply. Alternatively, the cell can also be operated in dead-end mode via controlled purge intervals at the cell outlet on the anode side.
In addition to the new sensor fuel cell, the central element of the test setup in the test stand was a system for generating material emissions, including control and regulation components from the INNO-KOM project PANAMA (49VF200058). The system was slightly adapted for the work with the new sensor cell. It is a multifunctional emission chamber that can be used for testing plastics, various assembly materials and functional materials under variable pressure, temperature and relative humidity parameters in in-situ test procedures. The chamber can be integrated into both anode and cathode-side circuits of fuel cells and covers various realistic fuel cell system conditions in the low-pressure range for material tests.
The emission chamber was positioned centrally at the lowest point and piped or hosed together with the sensor cell and the other components. The test setup is shown as an RI flow diagram in Figure 18. The sensor cell is supplied with hydrogen on the anode side via a closed media circuit. The hydrogen supply can be switched on either from the metal hydride storage tank filled by electrolysis or from the laboratory's ring line via a mass flow controller. An NC valve is integrated behind the cell. This enables a controlled purge when using the metal hydride storage tank in dead-end operation. In flow-through operation using MFC, it remains open continuously. On the cathode side, the sensor cell is also supplied with filtered air via a pressure reducer and MFC. Two 3/2-way valves are integrated in the line section upstream of the cell. In regular cell operation, the filtered air is supplied directly to the cathode. In sensor mode, however, the simultaneous switching of the two 3/2-way valves creates a bypass through the emission chamber and any harmful gases can be fed into the sensor cell in this way. At the cell outlet on the cathode side, a condensate separator collects the resulting product water from the sensor fuel cell before the excess air enters the fume cupboard of the test stand. The test setup has various pressure and temperature measuring points. In addition to safety-related monitoring, these are used to control the chamber and the load-controlled sensor cell.
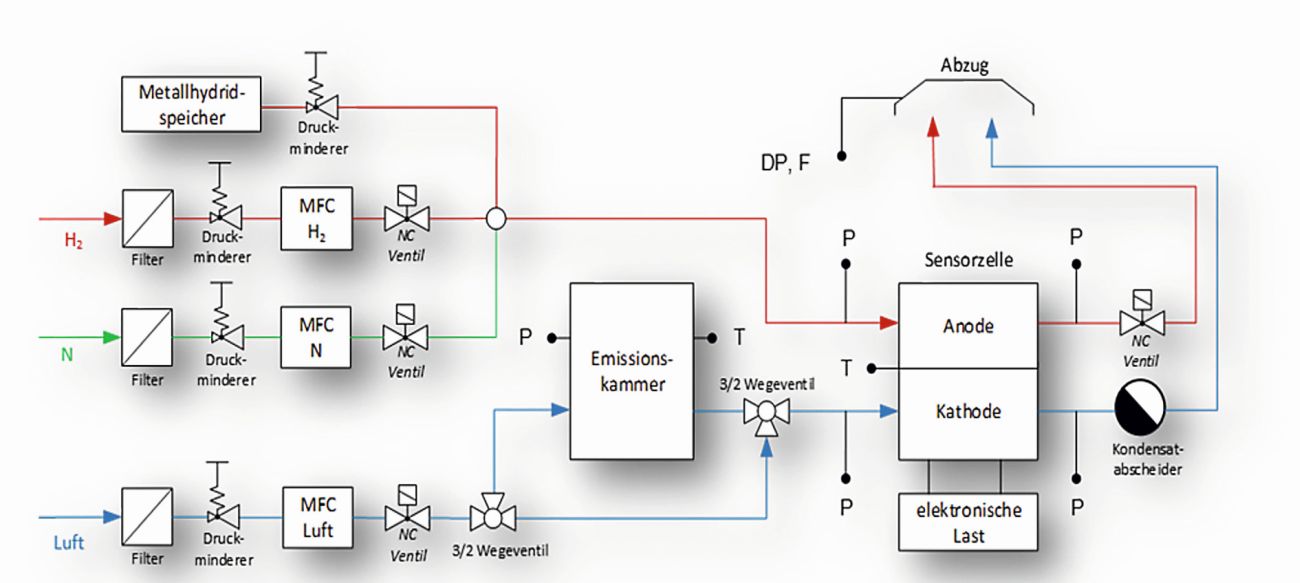 Fig. 18: P&I flow diagram of the sensor cell test setup
Testing and results
Testing of the new sensor fuel cells initially involved recording typical FC U(I) characteristics and power curves as well as carrying out pressure drop, temperature and reproducibility measurements. With the help of the previously presented holding frame with external device for cell tensioning, an internal cell tightness with regard to hydrogen and air was confirmed for all assembled functional samples. At the same time, the best possible contact pressure for the respective cell was determined. All sensor cells were operated at a laboratory ambient temperature of approx. 20 °C. Hydrogen and air for the cells were provided without external or additional humidification or temperature control. The sensor cells only humidified themselves during operation.
Figure 19 shows the U(I) characteristic and performance curve of one of the assembled and tested sensor cells. These were recorded during dead-end operation on the anode side with controlled hydrogen purges. On the cathode side, the air flow rate was adjusted between 60 - 110 ml/min in relation to the respective operating point. Under these conditions, the sensor cell with its 5 cm2 active reaction area has an open-circuit voltage of over 0.9 V and a short-circuit current density of over 0.6 A/cm2. The highest power density was measured at over 0.12 Wel/cm2 at a voltage level of 0.35 V.
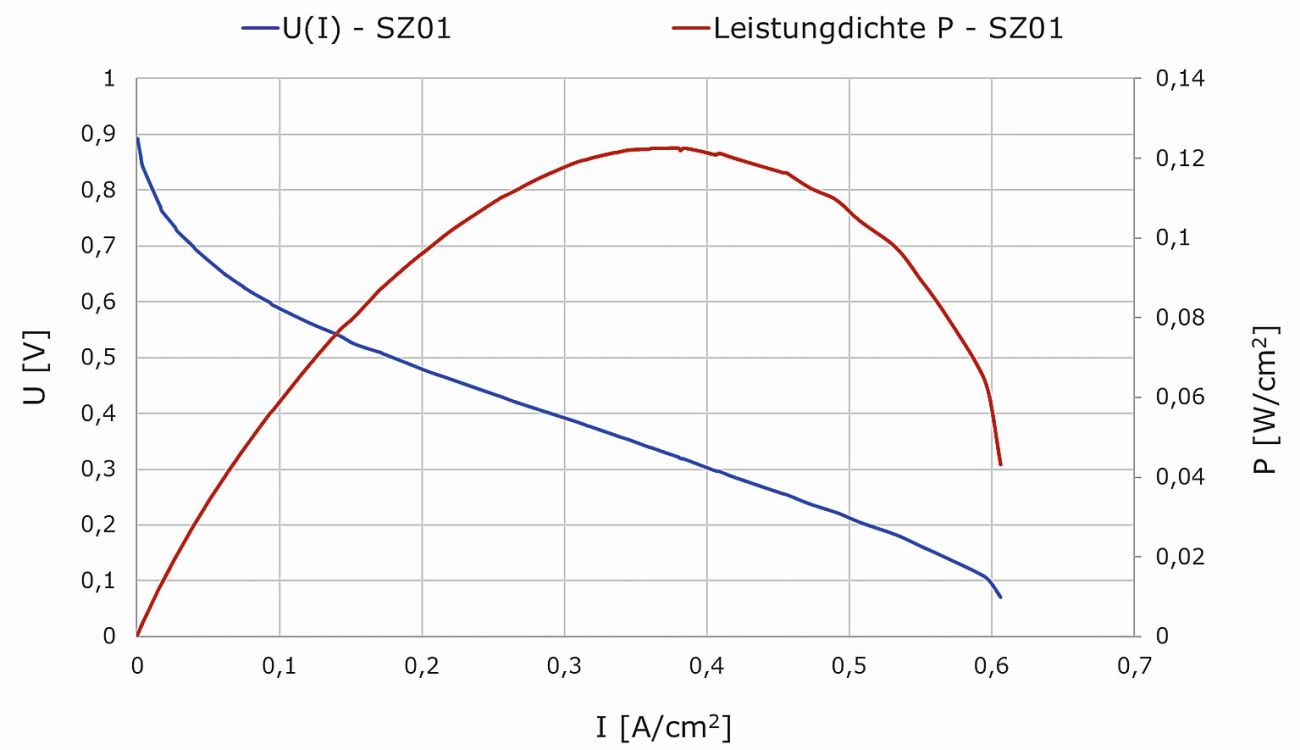 Fig. 19: U(I) characteristic and power curve of the sensor cell
With sensor cells, the focus is less on energy conversion and more on signaling. The central task of the new cells is the in-situ detection of factory and fuel emissions, which are harmful to PEM fuel cells in the low temperature range. For this purpose, the voltage signals are closely monitored under known operating conditions of the cells and changes in these signals are traced back to possible damage mechanisms. The voltage signal of the cells was therefore given increased importance. An important basic prerequisite for this was to obtain constant voltage signals under constant operating conditions.
Figure 20 shows the current, voltage and temperature curve of a sensor cell, which was recorded in a time window of two hours under constant operating and ambient conditions. The current generated by the cell was continuously regulated to 1.12 A via the resistance of the load. The air flow on the cathode side of the cell was varied between 40 and 60 ml/min within the first 15 minutes of the experiment and then kept constant at 60 ml/min. Hydrogen was supplied to the anode side from a metal hydride storage tank in dead-end operation at a constant purge interval with a purge of 250 ms every 60 s. The diagram shows how the voltage signal of the sensor cell settles at approx. 0.45 V after just 20 min and remains at this value for the rest of the test duration. In direct comparison, the cell temperature is slower than the voltage curve and only stabilizes at 43 °C after approx. one hour. On the cathode side, the cell visibly produces water under these conditions. Moisture was also clearly visible in the tube section behind the anode outlet on the anode side in the test presented. A closer look at the voltage signal over the time axis reveals occasional fluctuations in the range of approx. 5 mV. These correspond to the generation of product water when individual droplets get through the constriction of the SMC elbow fitting on the cathode side. Since a drop in the cell voltage signal only noticeably above 10 mV is attributed to possible contamination effects caused by foreign substances, these effects are within the tolerance range in this purely self-humidified and self-tempered operating mode.
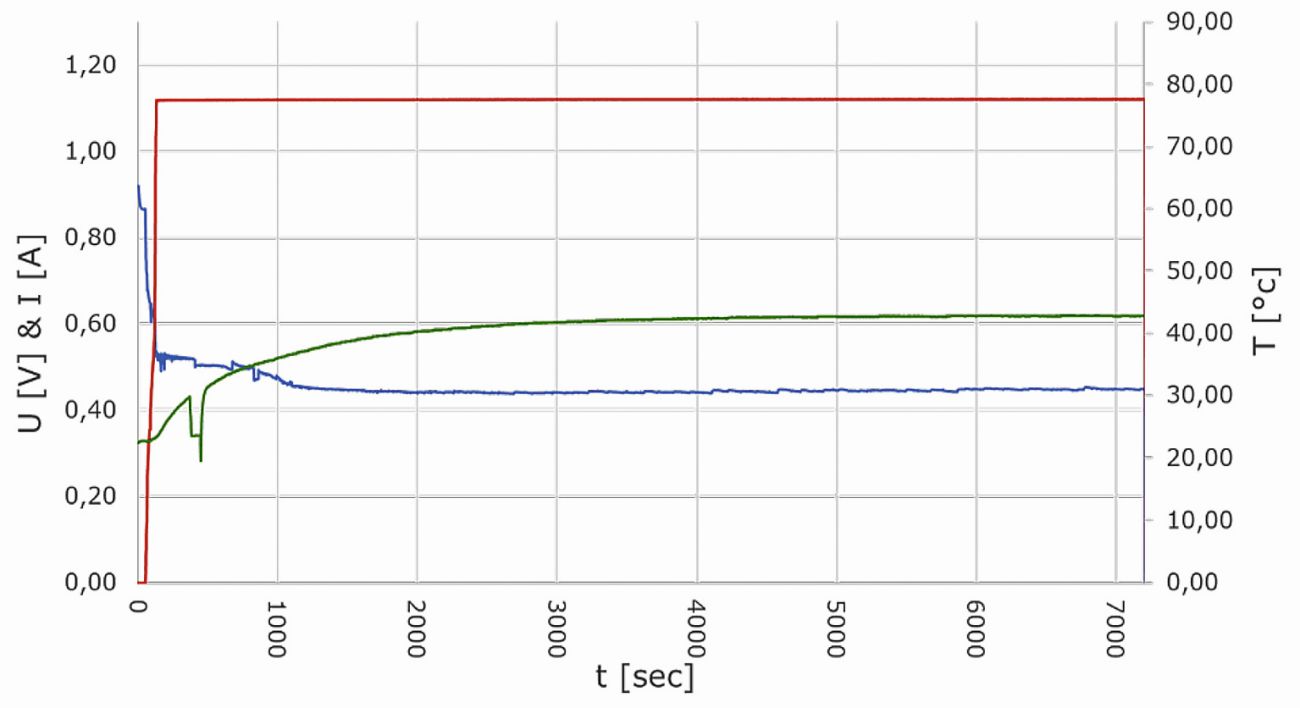 Fig. 20: Current (red), voltage (blue) and temperature (green) curve of a sensor cell at a constant operating working point
Finally, the new cells were used in combination with emission chambers to generate material emissions. A sensor cell was first operated with an unfilled chamber and different chamber temperatures in order to take into account the basic temperature influence of the chamber on the non-tempered cells. Several material samples made of ETFE-3300N were then placed in the chamber. The emissions of this material are known to have a damaging effect on the membrane catalyst. The material samples were outgassed at different temperatures between 40 °C and 90 °C inside the chamber and the contaminated air was fed to the cathode side of the sensor cell at different intervals. Each exposure led to a degradation of the cell performance, but at different rates depending on the temperature.
Figure 21 shows an experiment in which the material samples were first separately outgassed inside the chamber for 60 minutes via the switched bypass. The air containing emissions was then fed to the sensor cell in concentrated form. The selected operating working point at a low voltage of 0.3 V shows a clear deflection. At this point in the test, the cell already had a generally reduced performance because it had previously been exposed to the emissions of the ETFE-3300N material samples for several hours.
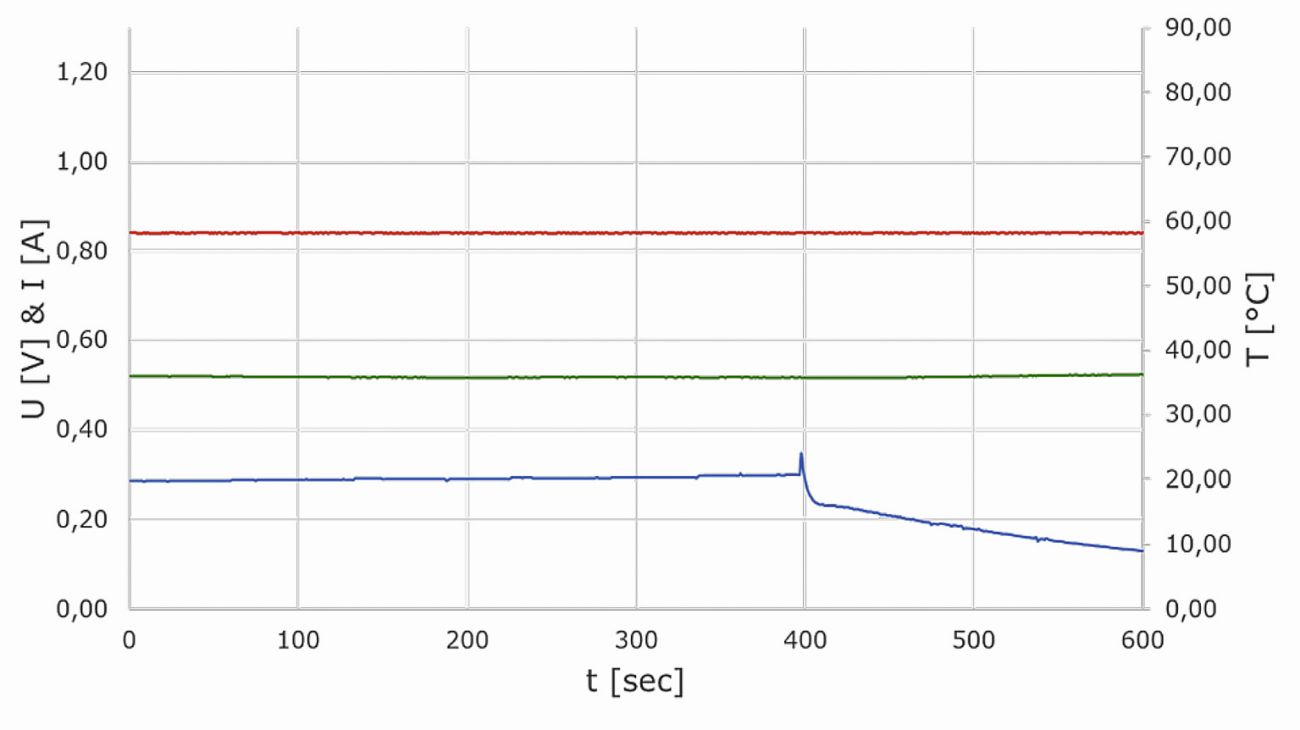 Fig. 21: Current (red), voltage (blue) and temperature (green) curve of a sensor cell at a constant operating working point
Summary
As part of IGF project 22754 N, a sensor fuel cell was developed based on 3D-printed polyamide 12 (PA12) components. The aim was to provide a cost-effective, robust consumable component for the detection of harmful emissions in hydrogen systems. Electrically conductive and hydrogen-tight surfaces were produced using a combination of electroless and galvanic metal deposition processes.
As part of the process development, various approaches to surface optimization were initially investigated. Although chemical smoothing of the 3D-printed PA12 surfaces significantly reduced the roughness, it led to considerable problems with the adhesion of the subsequently deposited metal layers. For this reason, chemical smoothing was dispensed with and the coating on the rough PA12 surface was optimized. Purely chemical layer systems made of nickel and gold deposited without external current showed limitations in terms of electrical conductivity and hydrogen impermeability. To overcome these challenges, a combined coating sequence was established: First, an adhesion-promoting nickel layer was applied without external current, followed by electroplated copper, nickel and finally gold layers. This layer sequence (chemNi/galvCu/galvNi/galvAu) achieved excellent adhesion, high conductivity and complete sealing against hydrogen.
The finished sensor cells have an active reaction area of 5 cm2 and were successfully characterized. They achieve an open-circuit voltage of over 0.9 V and a short-circuit current density of over 0.6 A/cm2. The highest power density was measured at over 0.12 Wel/cm2 at a voltage level of 0.35 V. The cells show high voltage stability under constant operating conditions, a prerequisite for the reliable detection of pollutant emissions. In exposure tests with known harmful emissions, a clear degradation of the cell voltage was demonstrated, confirming the high sensitivity of the sensor cells to contaminating substances.
Acknowledgements
The IGF project "Development of a manufacturing process for flexible designable sensor fuel cells based on 3D printing and electroplating technology", IGF project number 22754 N, was funded via the AIF as part of the program for the promotion of joint industrial research (IGF) by the Federal Ministry for Economic Affairs and Energy on the basis of a resolution of the German Bundestag. The authors would like to express their sincere thanks for the financial support they have received.

