
Part 1 in issue 10/2021 from p. 1315 dealt with 2D simulations that were used to test the influence of a dimensional reduction, smaller electrodes and cells as well as segmented electrodes on the current density distribution of the Hull cell. Furthermore, a multiple notch structure with further reduced indentations of the cathode was included. The 3D simulations described in this 2nd part were started on the standard Hull cell, whose bottom plate and insulating boundaries were removed one by one, which finally leads to the simulation of the current density distribution of the angle electrodes.
4 Three-dimensional simulation of the secondary current density distribution of Hull cell structures
In DIN 50957-2, angled cathodes were also described in addition to the long cell, thus extending the range of Hull cell-like structures. The advantage of angle cathodes over Hull cells is that deposition under movement is possible. As it is no longer possible to assume the same electrolyte properties in the vertical plane for such systems, the simulations must be carried out in three dimensions. The electrode height of the Hull cell is now explicitly taken into account so that changes in the vertical plane can also be described.
 Fig. 11: Spatial geometry of the different variants in analogy to the standard Hull cell
In exceptional cases, it is also possible to carry out Hull cell investigations in larger electrolyte containers. In this case, the bottom of the standard Hull cell is omitted and the remaining frame of the cell is completely (fill level > 44 mm) or partially immersed, e.g. up to the usual fill level mark of 44 mm.
In order to assess the simulation method, models analogous to the standard Hull cell with different filling levels of the electrolyte and different spatial arrangements were first selected.
With regard to the 3D simulation of the standard Hull cell, the following 3 variants were selected for the geometry, whereby the lateral boundary surfaces and the cathode remained unchanged (Fig. 11a):
- standard filling height of 44 mm as from DIN 50957-1
- without base plate and an additional 20 mm of electrolyte below the lower edges of the electrodes (total electrolyte height 64 mm), flush finish of the upper edges of the electrodes with electrolyte level
- without base plate and an additional 20 mm of electrolyte below and above the electrodes (total electrolyte height 84 mm)
If the side walls of the Hull cell are also removed, but the arrangement of the cathode and anode is left unchanged, this results in the conditions shown in Figure 11b for an open arrangement with electrodes positioned freely in space, which is similar to the situation in rack electroplating. Here, however, the anode and cathode are insulated at the back (variants b(1) and c(1) ). The only difference between the two variants is the immersion depth of the electrodes. The distances to the insulating container walls (side walls) are variable, in this case 50 mm each were chosen. The advantage of this arrangement is that it allows the inclined cathode to move. This allows an influence of the hydrodynamics on the deposition pattern to be determined. Furthermore, the two variants b(2) and b(3) were also included, whereby only the cathode was arranged freely in the space and the anode was positioned against the container wall.
The representation of the results can quickly become confusing, so that in addition to the spatial representation, (sectional) planes or contour drawings were used. The middle area of the Hull cell sheet in particular was selected for evaluation.
4.1 3D simulation of the standard Hull cell (variant a)
 Fig. 12: Secondary current density distribution over the cathode height h and width xThegeometry of variant a corresponds to the geometry specified in DIN 50957-1. The same secondary current density distribution is obtained over the length of the electrode x as in the two-dimensional case (black and red curves in Fig. 12a), see also [2]. And there are also no differences over the height h (Fig. 12b), so that the statement made in [2] that there are no current density differences over the height is confirmed. This can also be transferred to the current density distribution of the anode, whereby the same current density is present both in height and width.
Without further (boundary) conditions (such as gravitation, electrolyte movements, concentration differences or changes, etc.), there are no vertical changes in the layer thickness distribution of the standard cell when simulating the secondary current density distribution and therefore no advantage of the 3D over the 2D simulation. Accordingly, the simulations in Chapter 3 were still carried out in 2D.
4.2 3D simulation of the standard Hull cell - variants b and c as well as b(1) and c(1)
This is a standard Hull cell with a filling level greater than 44 mm and the electrodes free in space. With these arrangements, variants b and c, the electric field and the current lines no longer remain inside the Hull cell geometry (electrode arrangement), but extend over the lateral edge, shown in Figure 13a for variant c, both downwards and upwards. The color of the current lines indicates the electrolyte potential from the anode (red) to the cathode (blue) (see the field and color distribution in Fig. 4 of Part 1, GT 10/2021, p. 1318). There is also no longer a homogeneous field distribution in front of the anode.
: Variante c, b) Variante c(1)") Fig. 13: Simulation of the streamlines: a): Variant c, b) Variant c(1)
Fig. 13: Simulation of the streamlines: a): Variant c, b) Variant c(1)
The same can also be seen with variant c(1), here the electric field extends to the entire container, shown by the course of the current lines (Fig. 13b). A higher field strength occurs at the edges of the electrodes. The current lines are distributed over the entire space, whereby in the diagram they hit the edges and the surface of the electrodes and not the insulated rear side.
 Flächige Stromdichte-Verläufe auf der Kathode für Variante b (oben) und c (unten) sowie b) für Variante b(1) (oben) und c(1) unten c) die jeweiligen Stromdichteverläufe auf halber Höhe der Kathode") Fig. 14: a) Planar current density curves on the cathode for variant b (top) and c (bottom) and b) for variant b(1) (top) and c(1) (bottom) c) the respective current density curves at half the height of the cathode The planar distribution of the current density in the contour diagrams (Fig. 14a) shows the variation of the current density across the cathodes and, in particular, the increase in current density towards the edge areas. Thus, in addition to the left edge, one or two edge elevations can be observed in the longitudinal direction of the cathode (variants b and c). In variants b(1) and c(1), these edge elevations also occur at the right edge (Fig. 14b).
Fig. 14: a) Planar current density curves on the cathode for variant b (top) and c (bottom) and b) for variant b(1) (top) and c(1) (bottom) c) the respective current density curves at half the height of the cathode The planar distribution of the current density in the contour diagrams (Fig. 14a) shows the variation of the current density across the cathodes and, in particular, the increase in current density towards the edge areas. Thus, in addition to the left edge, one or two edge elevations can be observed in the longitudinal direction of the cathode (variants b and c). In variants b(1) and c(1), these edge elevations also occur at the right edge (Fig. 14b).
According to DIN 50957-1, the layer thickness is measured in the center of the cathode. If only the middle area of the cathode is considered (horizontal center line), the current density decreases from left to right with increasing x (variants b and c), while with variants b(1) and c(1) the decrease goes through a minimum (at x = 75 mm) and increases again towards the right edge (Fig. 14a and b). If we now compare the current density curve in the middle of the cathode with that of the standard Hull cell, we can see that this curve is considerably flatter with the four variants (Fig. 14c). For example, the simulation results in smaller current densities for variant b with a small x (e.g. at x = 5 mm approx. 3-4 A/dm2 compared to 6 A/dm2) and larger current densities with a large x (around x = 90 mm approx. 0.5 A/dm2 compared to almost zero). The current densities in the descending range are always greater with variants b or b(1) than with variants c or c(1).
In summary, it can be said that a free arrangement of the electrodes in space has several advantages over the standard Hull cell: mobility of the cathode, constancy of the temperature and the concentrations including the brighteners, design directly on the working container or a larger container. The smaller current density range is not necessarily a disadvantage, but requires additional tests with higher currents. The vortices occurring at the reversal points of the back and forth movement of the electrodes must be taken into account.
4.3 Zinc deposition - simulation and experimental data: Anode on the tank wall and distance variation to the tank frame
In the experimental implementation, the arrangement deviated from the "ideal" geometry shown in Figure 11 with regard to variants b(1) and c(1). Therefore, changes had to be made to the position of the anode and the container width (variants b(2) and b(3)), which consisted of the anode resting directly against the container wall (Fig. 11). With regard to the electrodes, a flush finish of the upper edges of the electrodes with the electrolyte level was selected according to variant b. In a 40-liter tank, there was sufficient distance from the electrodes to the side walls of the tank (variant b(2)); in a smaller arrangement, the distance between the electrodes and the side walls and bottom was approx. 5-10 mm (variant b(3)). Zinc was deposited from acidic electrolytes both with and without movement of the cathode; the average distance between the cathode and the anode was 48 mm.
The following parameters were used to simulate the secondary current density distribution of zinc deposition from acid electrolytes: j0= 0.0291 A/m2,ba = 47 V-1 , bk = 31 V-1 and the conductivity κ = 20 S/m.
The simulations for variant b(2) showed no differences in the cathodic current density distribution compared to the simulation results with variant b(1), see Figure 14b.
, I = 2 A, a) Simulierte flächige Verteilung b) experimentelle flächige Verteilung einer Zinkabscheidung c) Verlauf der Stromdichten an Schnittlinien in unterschiedlichen Höhen bezogen auf den unteren Rand") Fig. 15: Secondary current density distribution of variant b(3), I = 2 A, a) Simulated areal distribution b) Experimental areal distribution of a zinc deposition c) Course of the current densities at cut lines at different heights in relation to the lower edge
Fig. 15: Secondary current density distribution of variant b(3), I = 2 A, a) Simulated areal distribution b) Experimental areal distribution of a zinc deposition c) Course of the current densities at cut lines at different heights in relation to the lower edge
In the simulation for variant b(3), on the other hand, the influence of the insulating walls in the immediate vicinity can be seen; in the upper part up to the middle over the height h, relatively constant current densities result (Fig. 15a), with a cell current of 2 A. Along the center of the electrode from point 3 to point 4, the local current density first decreases and then increases again slightly, with a minimum between 80-90 mm. Compared to the standard Hull cell, the drop in current density over the length x of the Hull cell sheet at different heights is somewhat flatter from the top to the middle (Fig. 15b) and steeper again at the lower edge (4 mm from the bottom). Compared to the variants b and b(1), this variant b(3) results in a stronger approximation of the current density distribution to the standard Hull cell in the middle area, but could no longer be achieved experimentally in technical container sizes.
A zinc deposition according to variant b(3) was investigated experimentally, whereby the cathode was moved in the longitudinal direction to the anode. The zinc layer thicknesses were measured up to 3 mm from the edge. The zinc current densities along the center of the deposition are also plotted (black dots), with almost the same curve. The areal distribution of the current densities also coincides well with the simulated distribution (Fig. 15c).
5 Three-dimensional simulation of the secondary current density distribution of angled cathode sheets according to DIN 50957-2 [1]
![Abb. 16: Geometrie der Winkelbleche Typ 1 (75 cm²) und Typ 2 (100 cm²). Längenangaben in mm, (außerhalb Elektrolyt) nach [1]](/images/stories/Abo-2022-05/gt-2022-05-0053.jpg "Abb. 16: Geometrie der Winkelbleche Typ 1 (75 cm²) und Typ 2 (100 cm²). Längenangaben in mm, (außerhalb Elektrolyt) nach [1]") Fig. 16: Geometry of type 1 (75 cm²) and type 2 (100 cm²) angled sheets. Lengths in mm, (outside electrolyte) according to [1] The newly standardized angled cathodes in DIN 50957-2 only specify the geometry of the cathode (Fig. 16), whereby type 1 represents the smaller (75 cm2, approx. 22 mm notch depth), simpler geometry and type 2 (100 cm2, 17 mm notch depth) the more complex geometry with four holes and defined curves. In both, the symmetrical notch has an angle of 60°, so that the half angle is comparable to the acute angle of the Hull cell. The number (typically one plus two) and arrangement of the electrodes (parallel) as well as the electrolyte and electrode movement are left to the experimenter to reproduce the conditions in the rack electroplating as closely as possible.
Fig. 16: Geometry of type 1 (75 cm²) and type 2 (100 cm²) angled sheets. Lengths in mm, (outside electrolyte) according to [1] The newly standardized angled cathodes in DIN 50957-2 only specify the geometry of the cathode (Fig. 16), whereby type 1 represents the smaller (75 cm2, approx. 22 mm notch depth), simpler geometry and type 2 (100 cm2, 17 mm notch depth) the more complex geometry with four holes and defined curves. In both, the symmetrical notch has an angle of 60°, so that the half angle is comparable to the acute angle of the Hull cell. The number (typically one plus two) and arrangement of the electrodes (parallel) as well as the electrolyte and electrode movement are left to the experimenter to reproduce the conditions in the rack electroplating as closely as possible.
As the simulation must be carried out in 3D, we have limited ourselves to a static configuration with centrally positioned angled cathodes in a cubic (x=y=z=10 cm) basic geometry, with the two anodes on the walls (Fig. 17). This results in a distance of 5 cm between the back of the cathode and the anode, while the distance between the edge of the front and the anode is only 2.8 cm. The sheet thicknesses were 1 mm (type 1) and 0.3 mm (type 2) and in the first case the bending edges were not rounded.
The simulation of the current density distribution allows further degrees of freedom with regard to the original arrangement, e.g: Variation of the current, the anode size (Fig. 17a and b), the number of anodes as well as the electrochemical parameters.
While the current density distributions are available for the standardized Hull cells, there are as yet no values for the fixed angle structures. Inhomogeneous ratios are to be expected, so that, for example, current density curves must be generated from the planar current density distribution for certain intersection lines. With regard to the comparability of different electrolytes, for example, the center line in the z-direction is selected by definition, as are the bending edges (a, b and c) (Fig. 16, Fig. 17).
 (Maße in mm, Breite des Blechs 33 mm, Beschichtungslänge 113 mm), Beschichtungsfläche 75 cm2, bei I=1 A, jm=1,33 A/dm2, Anoden (rot) parallel zum Winkelblech z.B. a) 100x100 mm2 (Variante a1) bzw. b) 30x80 mm2 (Variante a2)") Fig. 17: Perspective view of the geometry of the angled cathode sheet from DIN 50957-2 type 1 (analogous for type 2) (dimensions in mm, width of the sheet 33 mm, coating length 113 mm), coating area 75 cm2, at I=1 A, jm=1.33 A/dm2, anodes (red) parallel to the angled sheet e.g. a) 100x100 mm2 (variant a1) or b) 30x80 mm2 (variant a2)
Fig. 17: Perspective view of the geometry of the angled cathode sheet from DIN 50957-2 type 1 (analogous for type 2) (dimensions in mm, width of the sheet 33 mm, coating length 113 mm), coating area 75 cm2, at I=1 A, jm=1.33 A/dm2, anodes (red) parallel to the angled sheet e.g. a) 100x100 mm2 (variant a1) or b) 30x80 mm2 (variant a2)
5.1 Result of the simulation of the secondary current density distribution: Type 1 (I =1 A 1.33 A/dm2)
The simulations produce the current waveforms in the electrolyte shown in Figure 18a and b for the two anode variants. The electric field is homogeneous from the anodes to close to the cathode (variant a1). This means that the current lines run parallel from the anodes, which fill the entire cross-section, and the curvature of the current lines only occurs near the cathode. This was already pointed out in [2] for the standard Hull cell. The size of the anode plays no or only a subordinate role. With the smaller anodes (variant a2), the homogeneous area is smaller and only forms in the middle between the cathode and anode. The curvature at the cathode is then also identical to that with the larger anodes.
 vollflächige Anoden (Variante a1) und b) projektionsgleiche Anoden (Variante a2). Die Farbe gibt das lokale Elektrolytpotential wieder") Fig. 18: Simulation of the current lines for a) full-surface anodes (variant a1) and b) anodes with the same projection (variant a2). The color indicates the local electrolyte potential
Fig. 18: Simulation of the current lines for a) full-surface anodes (variant a1) and b) anodes with the same projection (variant a2). The color indicates the local electrolyte potential
The planar representation of the current density distribution (Fig. 19) already provides a qualitatively good overview of the scattering ability of the electrolytes. As there are no differences between the variants a1 and a2, only variant a1 is referred to here(Fig. 18a and see Chap. 2.1, GT 10-2021, p. 1316). This results in a symmetrical current density distribution on both sides with the vertical center line as the axis of symmetry. The current densities are higher on all outer edges than on the surfaces, with the highest being in the center of the outer edge c (front). At the inner edges (front side of edges a and b and the inner side of c), on the other hand, the current density decreases towards the center and has a global minimum in the notch (inner edge c). The current densities along the center in the z-direction (Fig. 20a) and along edge a (Fig. 20b) were used for quantification. On the front side, the current density decreases from the top to the first hollow edge and then reaches a maximum at the pointed edge at approx. 4 A/dm2 (almost by a factor of 8 from edge a to c). A strong increase is observed again at the lower edge.
 (Vorder- und Rückseite)") Fig. 19: Secondary current density distribution on the angular cathode type 1 (variant a1) (front and back)
Fig. 19: Secondary current density distribution on the angular cathode type 1 (variant a1) (front and back)
In contrast, there is a slight increase in current density on the rear side up to the first edge and then an extremely sharp drop towards the hollow edge with the lowest current density of the sheet. With the simulation parameters used here, the minimum is approx. 0.1 A/dm2. The increase in current density at the lower edge is also almost the same as on the front side. At edge a, the uneven current density distribution from the inside to the outside can also be seen across the width of the sheet (Fig. 20b).
 entlang der Mittellinie von Abbildung 19 sowie b) entlang Kante a (Vorder- und Rückseite)") Fig. 20: Current density distribution a) along the center line of Figure 19 and b) along edge a (front and back)
Fig. 20: Current density distribution a) along the center line of Figure 19 and b) along edge a (front and back)
 Vorderseite und b) aufgeklappte Rückseite") Fig. 21: Nickel-chromium deposition on a type 1 brass cathode. a) front side and b) unfolded back side The current density curves on the flanks of the tip or notch are almost symmetrical, which means that the adjacent surfaces with their different current density curves have no noticeable influence on them. The dependence of the current density distribution on the mean current density is explained with the type 2 angle plate (section 5.5). If the angle structure is interpreted like a Hull cell, the curve for one edge of the notch can be approximated analogously to the Hull cell using equation (1); the approximation is shown as a dashed line in Figure 20. Figure 20a also shows experimental data of a thin nickel layer of a nickel-dark chromium deposition [11], which correspond well with the simulated curves. It can already be seen visually (Fig. 21) that no chromium from the chromium(III) electrolyte has deposited in the hollow edge and that nickel in the middle of the notch barely covers the brass substrate (directly in the notch approx. 0.1 µm).
Fig. 21: Nickel-chromium deposition on a type 1 brass cathode. a) front side and b) unfolded back side The current density curves on the flanks of the tip or notch are almost symmetrical, which means that the adjacent surfaces with their different current density curves have no noticeable influence on them. The dependence of the current density distribution on the mean current density is explained with the type 2 angle plate (section 5.5). If the angle structure is interpreted like a Hull cell, the curve for one edge of the notch can be approximated analogously to the Hull cell using equation (1); the approximation is shown as a dashed line in Figure 20. Figure 20a also shows experimental data of a thin nickel layer of a nickel-dark chromium deposition [11], which correspond well with the simulated curves. It can already be seen visually (Fig. 21) that no chromium from the chromium(III) electrolyte has deposited in the hollow edge and that nickel in the middle of the notch barely covers the brass substrate (directly in the notch approx. 0.1 µm).
5.2 Angled cathode type 1 with only one anode or with the insulation on the front side
DIN 50957-1 assumes 2 anodes. In principle, the question of what differences would result if only one anode is used can be quickly answered by simulation. As this results in an asymmetry, the side facing away receives less current, a current slightly greater than 0.5 A was selected for the model calculation, so that the average current density on the respective sides is approximately the same as in Figure 20 above.
Anode to front side: There is no difference in the current density distribution on the front side (Fig. 20a). The rear side is strongly shielded and the current densities drop by half outside the trench structure. The minimum in the trench structure remains the same (Fig. 22a).
Anode to back surface: The current density curve on the back surface is almost unchanged compared to Figure 20a. On the front side, the current density is reduced to approx. 1/5 at the maximum, otherwise to about half (Fig. 22b).
 der Vorderseite und b) der Rückseite (Strom jeweils 0,65 A)") Fig. 22: Current density distribution anode compared to a) the front side and b) the back side (current 0.65 A each)
Fig. 22: Current density distribution anode compared to a) the front side and b) the back side (current 0.65 A each)
If the deposition only takes place on the rear side and the front side is insulated, the current density curve is the same as in Figure 20a (green curve, I = 0.5 A). In principle, it is now possible to deviate from the arrangement with two anodes, depending on what is of particular interest, e.g. the high or low current densities.
5.3 Influence of the tank length and width
The distance between the two anodes has no influence on the current density distribution. If the box is extended from 100 mm to 350 mm in the y-direction, the simulation calculations resulted in identical current density distributions (anodes corresponding to variant a1).
This also applies to an increase in the container width. If the tank width is reduced, the high current densities at the side edges decrease. If a small gap remains between the side edges of the angle plate and the tank wall, a similar behavior as in chapter 4.3 will occur.
5.4 Result of the simulation of the secondary current density distribution: type 2 angle cathode (I = 5 A, j = 5 A/dm2)
In principle, similar simulation results (Fig. 23a) were obtained for the type 2 cathodes, so that the statements from Chapter 5.1 also apply to these. However, there are some deviations that ensure a more uniform and therefore better deposition. On the one hand, the holes lead to a locally limited increase in current density around them (Fig. 23b and d). On the other hand, the rounded bending edges significantly reduce the current density extrema, as already discussed for the notch structure (Chapter 3.1). The first nickel depositions were also carried out here (Fig. 23e) and the current density curve along the vertical center line confirms the results of the simulation (Fig. 23c), both on the front and back sides.
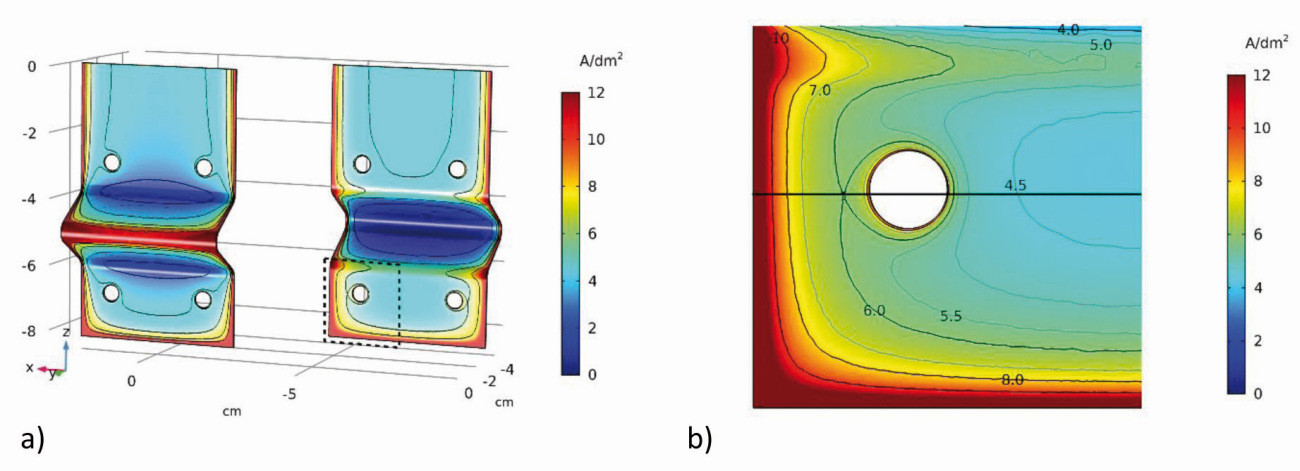
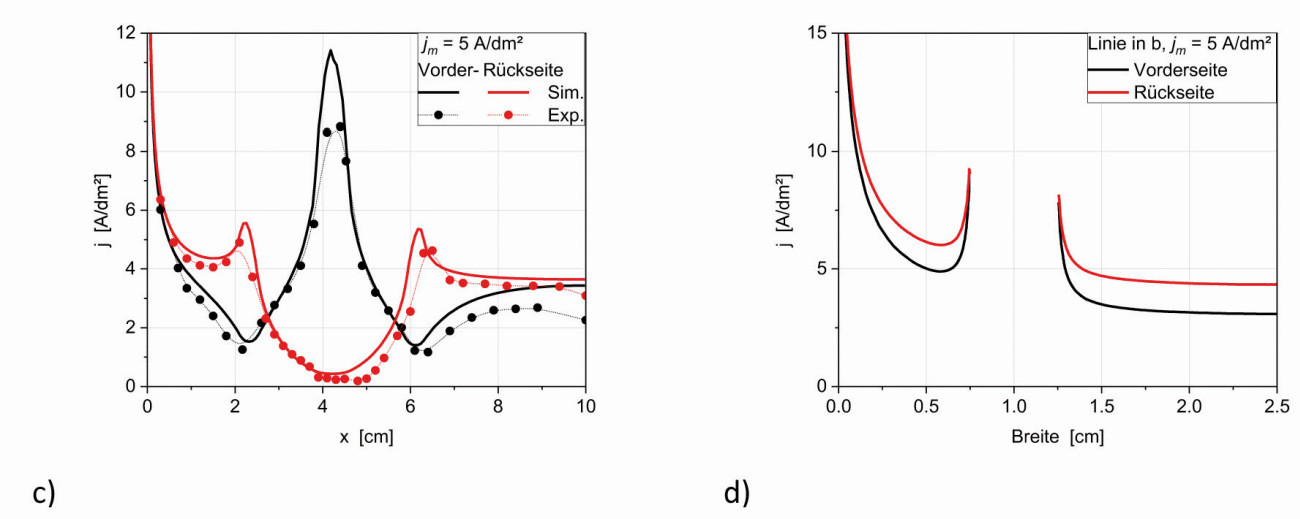
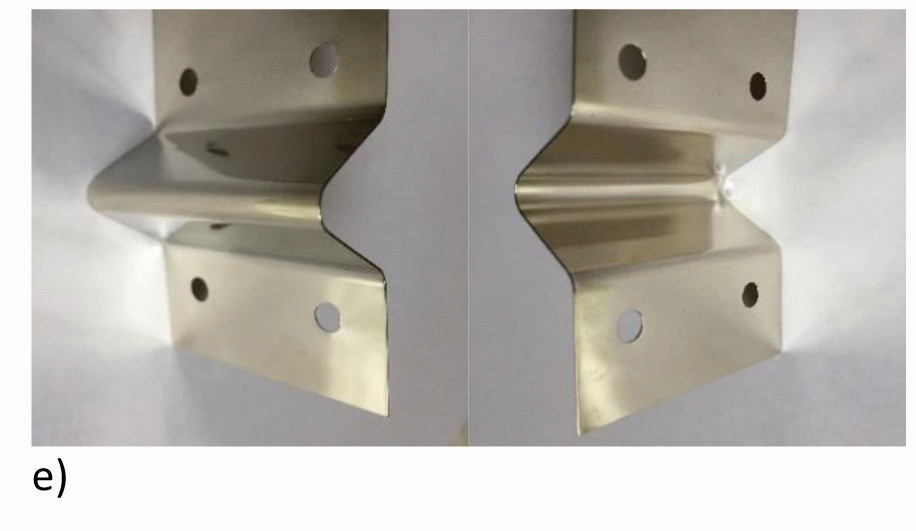
Fig. 23:
Current density distribution of the type 2 cathode at jm= 5 A/dm²
a) flat on front and rear side
b) Detailed representation from a
c) Current density on the vertical centerline and corresponding experimental data of a nickel-plated angle plate
d) Current density curve in x-direction corresponding to the line in b
e) Nickel-plated sample
Figure 24a shows the current density distribution on the vertical center line for several (applied) average current densities. As the current increases, there is an increase in the current density at the protruding surfaces and edges, particularly at edge c on the front and edges a and b on the back, while the current density in the hollow edge of the back increases only slightly (Fig. 24b). Thus, the relative ratio between the maximum current on the front side and the minimum current on the back side also increases. This in turn reflects the behavior that with increasing (decreasing) current densities, the macroscattering ability becomes worse (better) [2]. The behavior is similar for the type 1 angle cathode (Fig. 24c), whereby the current densities in the notch are significantly lower compared to type 2 at the same current.
If type 1 and type 2 are compared at an applied current of 1 A, a clear effect of edge rounding can be seen: the current density extrema decrease from 4:0.1 (type 1, Fig. 20) to 2:0.4 (type 2, Fig. 24a, purple and blue curve). Only at 5 A does type 2 achieve similarly high differences (11:0.2).
6 Summary and conclusions
Hull cells or structures similar to Hull cells are used in electroplating technology in order to be able to quickly make statements about the current density dependence of the deposits, particularly with regard to appearance, and to be able to practically estimate the macroscattering capability of the various electrolytes. Simulations are increasingly being used to optimize and better understand deposition tests. However, the selected conditions and the assumptions and simplifications made must always be taken into account. For example, the simulation of current density distributions (and their interpretation) requires electrochemical parameters such as exchange current density and Tafel factors, which in principle must be determined for each electrolyte, or plausible assumptions must be made.
In the examples shown here, the simulation of the secondary current density distribution reflects the real current density distribution much better than the simulation of the primary current density distribution, which does not use any electrochemical parameters. This is particularly evident in the low current density range.
By including these parameters and the electrolyte conductivity, the secondary current density distribution can be calculated for such structures, as shown here for the variations of the standard Hull cell with regard to electrode size, segmentation, notch structures, container size and geometry as well as the angled cathodes. For the first time, simulation results were obtained for angle cathodes, which are standardized in DIN 50957-2 [1]. It was shown that the current densities at the bottom of the notch are similarly low for angle cathodes as in the standard Hull cell at the acute angle. Compared to the standard Hull cell, angle cathodes have the advantage that they can not only be used statically. The proposed geometries are similar with regard to angled plates that are freely arranged in space.
In practice, according to DIN 50957, only the middle strip of the sheet is included in the consideration, the upper or lower strip is not taken into account. For nickel coatings, the electrochemical parameters used are in good agreement with the calculated values both in the 3D simulation and in 2D [2]. For the deposition of other metals from their electrolytes, this requires a corresponding adjustment or the inclusion of side reactions such as hydrogen evolution. For zinc electrolytes in particular, further investigations into the parameters are necessary.
The 3D simulation of the standard Hull cell in section 4.1 showed that under the given boundary conditions there are no differences in current density over the height of the cathode. In real processes, however, other influencing factors such as hydrodynamics and concentration changes in the diffusion layer cannot be neglected, which also leads to deviations in the current density and thus the layer thickness distribution over the height of the cathode.
For the simulation of the tertiary current density distribution, this requires further upgrading of the models and, in particular, a complex linking of the electrochemical model with the hydrodynamic model. However, the simulation of influenced convection, i.e. without additional stirring, as occurs in the Hull cell, is not defined. This also applies to the moving angular cathodes (forced convection), which are intended to represent the rack coating on a small scale. Only investigations to determine the mass transfer coefficient or the limiting current densities in the x and y directions of the Hull cell can help here.
Thanks go to M. Lerp, S. Schorn as well as Dr. C. Kubeil, M. Fritz, C. Tschaar, M. Leimbach, R. Krauß and R. Gensicke.
Literature
[1] DIN50957-1 and -2
[2] Schmidt, U.; Peipmann, R.; Bund, A.: Galvanotechnik 112 (2021)(3), 301
[3] COMSOL Multiphysics®, COMSOL AB, Tegnergatan 23, SE-111 40 Stockholm
[4] Kudryavtsev, N. T.; Kuznetsov, V. P.; Nachinov, G. N.; Pachushkina, L. A., Zhurnal Prikladnoi Khimii 54 (1981)(3), 580 and Nachinov, G.N. and Kudryavtsev, N. T:; Itogi Nauki Tekh., Ser. Elektrokhimiya, 15 (1979), 179
[5] Chmielowiec, B.; Cai, T.; Allanore, A.: Journal of The Electrochemical Society 163 (2016)(5), E142-E146
[6] Strauß, T.; Sun, Y.; Schmidt, U.: Galvanotechnik 105 (2014) 264
[7] Company publication (catalog) of Yamamoto-MS Co., LTD, Tokyo, Japan
[8] CELL-DESIGN®, Software for Computer Aided Design and Simulation of Electrochemical Cells, L-Chem, Inc., 13909 Larchmere Blvd. Shaker Heights, OH 4412
[9] Galvanogerechtes Konstruieren und Fertigen industrieller Bauteile, ZVO-Broschüre 97030, 2012
[10] Schorn, S.; Fritz, M.; Schmidt, U.; Bund, A.: Experiment und Simulation bei der Galvanoformung mit Nickel- Elektrolyten, Vortrag ZVO-Tagung Garmisch-Partenkirchen 2016
[11] Salloum, B.; Gruia, V.; Schmidt, U.; Bund, A.: unpublished 2018
