
Will copper prices continue to go through the roof? Before the Covid-19 pandemic, shortages of goods were a rare phenomenon in the developed Western world. But suddenly the global market economy was upside down and shortage management became the new normal.
After the lack of microchips for the automotive industry, among others, we have now reached important raw materials - such as copper. Everyone wants a slice of the copper pie, but production volumes are currently limited to 20 million tons(Fig. 1, 2). The world's largest copper deposits are in Chile (current output of 5.7 million tons). Peru, China and the Congo follow in 2nd, 3rd and 4th place, and together produce less than the country on the western edge of the South American continent.
Chile's reserves of the non-ferrous metal totaled 200 million tonnes in 2020. Significantly fewer deposits are located in Australia (87 million tons) and Peru. The United States Geological Survey (USGS) estimated global recoverable reserves at 870 million tons in January 2020(Fig. 3). Based on current production volumes, this would last for around 40 years.
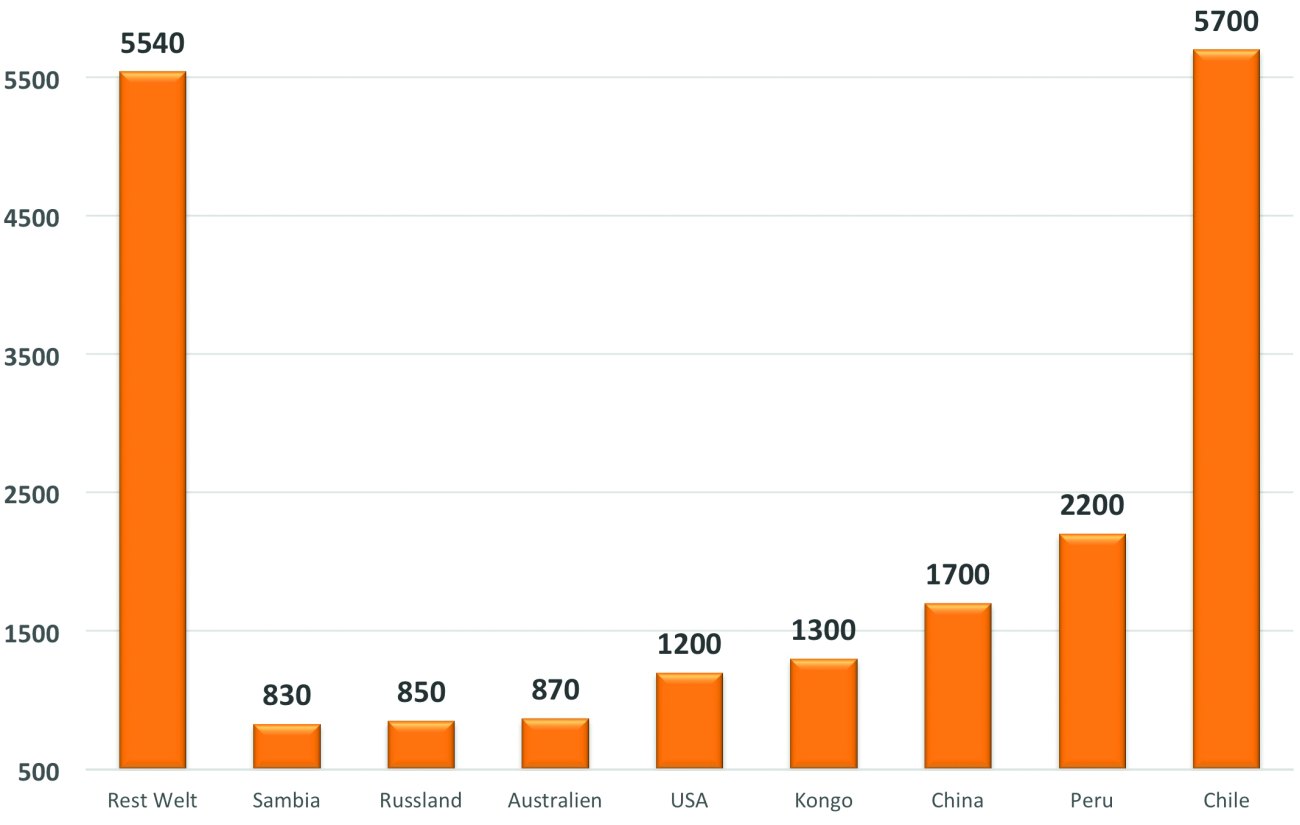 Fig. 2: Mine production copper 2020 world in 1000 tons (source: Friedrichkeit, Statistica)
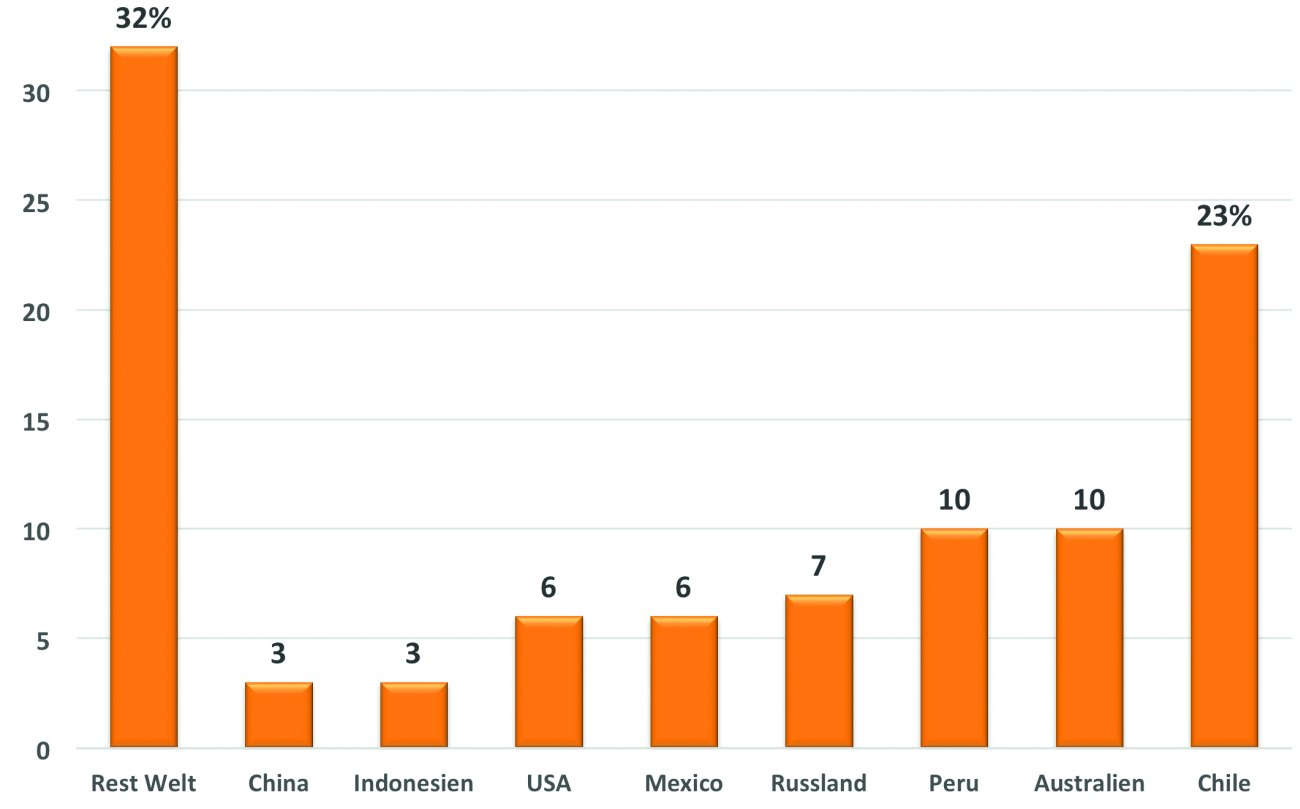 Fig. 3: Copper production reserves by country 2019 in percent (source: Friedrichkeit; Markit Economics)
Production process of copper cathodes
The production process(Fig. 4) leads from an ore rock with a copper content of approx. 0.2 % to a copper cathode of 99.99 % purity. 90% of copper ore is mined in open-cast mines(Fig. 1). Near-surface ores can be mined after the overburden has been removed. In the first process step, the copper ore is crushed and then ground into powder. This is then enriched using a process called froth flotation. Unwanted material, called gangue, sinks to the bottom and is removed.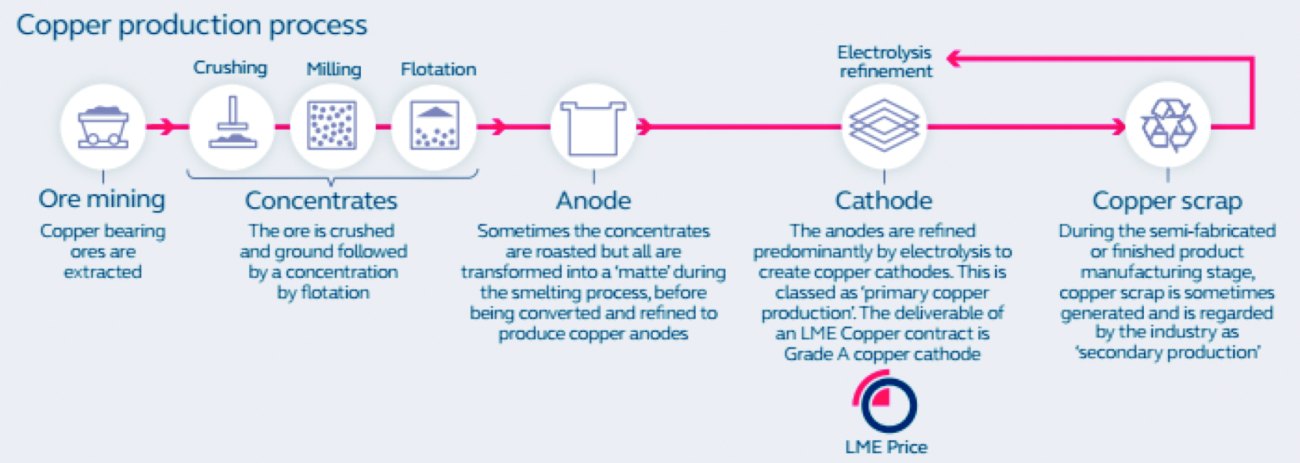 Fig. 4: The production process of copper cathodes from copper ore to electrolysis (Image: LME)
The chemical reactions begin during roasting: The pulverized, enriched and pre-cleaned ore is heated in the air between 500 °C and 700 °C to dry it and remove some of the sulphur. The intermediate stage now reached is called calcination.
The solid calcinate is heated to 1200 °C and melts. Some impurities are removed and a mat (a mixture of liquid copper and iron sulphide) is formed. Air is blown into the liquid mat, creating blister copper, so called because the gas bubbles trapped in the solid form bubbles on the surface. In the subsequent anode casting process, the blister is cast into anodes for electrolysis. Electrolytic refining is used to purify the copper to a purity of 99.99%.
The dominant consumers: China and the rest of Asia
At over 50 %, China consumes more than 10 million tons per year(Fig. 5). Together with the other Asian countries, this amounts to 70 % or 14 million tons of the 20 million tons of copper currently produced worldwide. Europe follows with a 17% share and the American continent with 12%.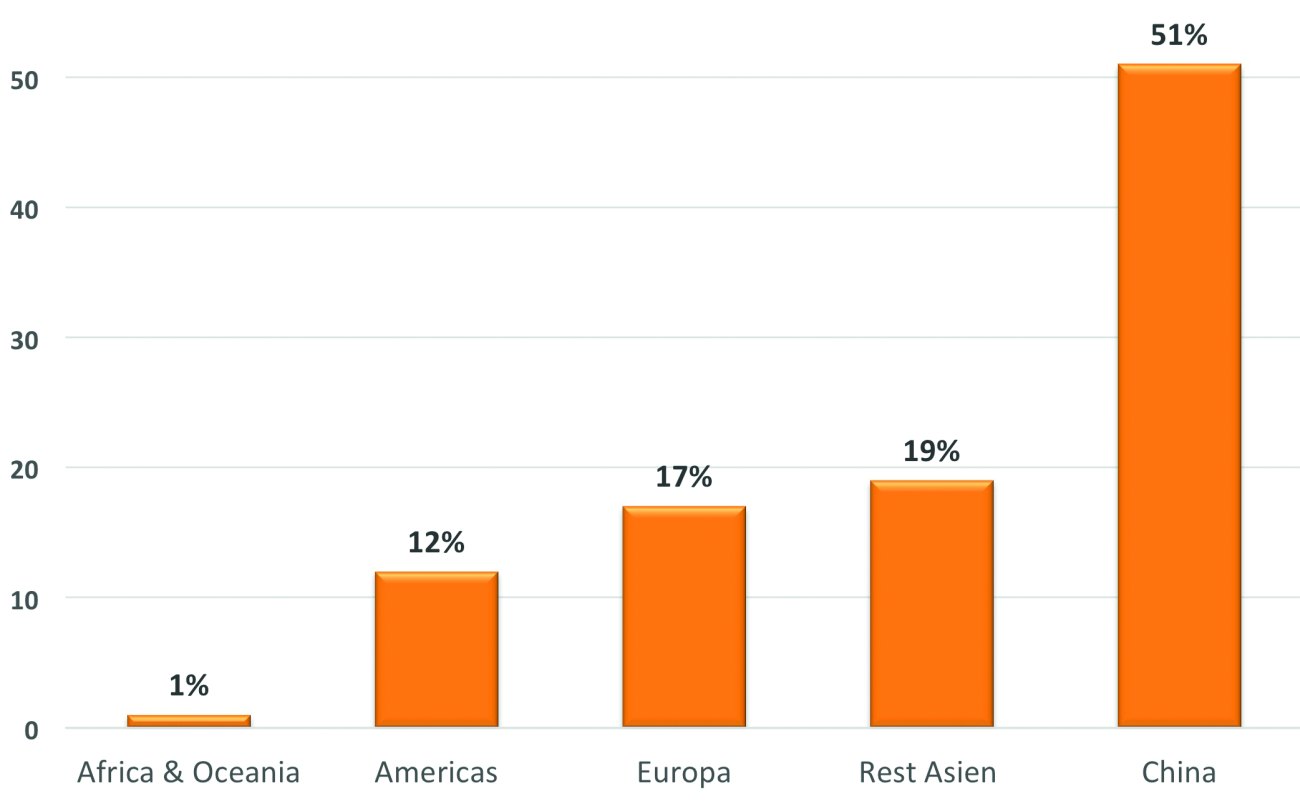 Fig. 5: Copper consumption by country in 2019 as a percentage (source: Friedrichkeit; Statista)
While industry only accounts for 11% of global copper consumption, demand for the buildings and equipment segment is 29% and 31% respectively(Fig. 6). With a combined share of 45%, the buildings and infrastructure segment consumes a considerable proportion. China in particular has emerged as a major consumer in the last two decades in the development of its infrastructure and in the construction sector. As little has been demolished here, the proportion of reusable scrap is low, in contrast to Europe with its high level of recycling.
Electromobility and digitalization are driving demand
Electromobility - and battery production in particular - has become an exponentially growing consumer of copper foil and cable. At the same time, digitalization, also driven by the pandemic, has picked up tremendous momentum. On top of this comes the rapidly growing global population in need of accommodation. At 29%, the Building Construction segment is the second largest consumer of copper(Fig. 6).
On average, a plug-in hybrid passenger car (PHEV) requires three times as much copper as a vehicle with an internal combustion engine and four times as much as a battery electric vehicle (BEV)(Fig. 7).
The battery consists of 18% copper by weight, as the anode is made of copper as a carrier material and the cathode is made of aluminum. Copper is also required for the electric motor, high-voltage electrical system, power electronics and others.
Will copper prices continue to go through the roof?
Since the beginning of the millennium, copper prices have been driven not only by demand in various segments(Fig. 6), but also by speculation on the part of investors.
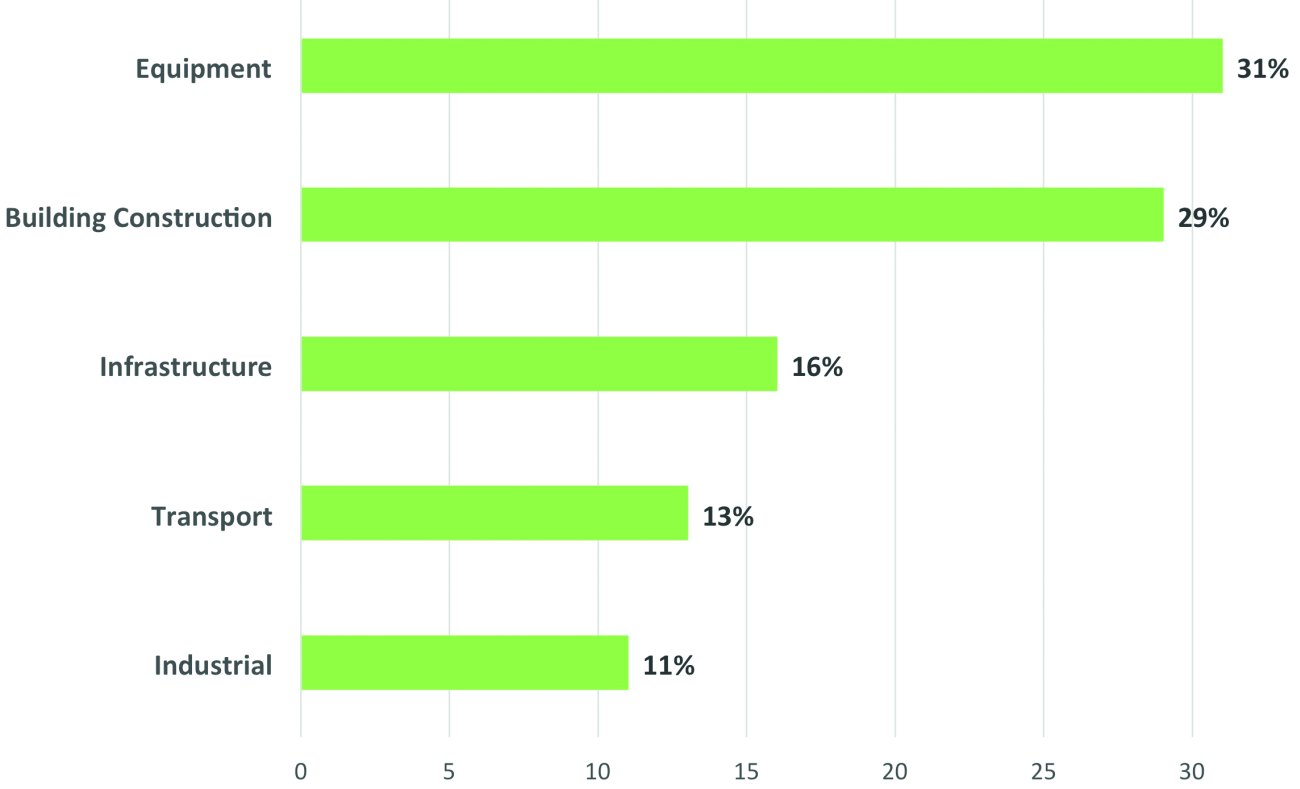 Fig. 6: Copper consumption by industry segment in 2016 in percent (source: Friedrichkeit, ICSG)
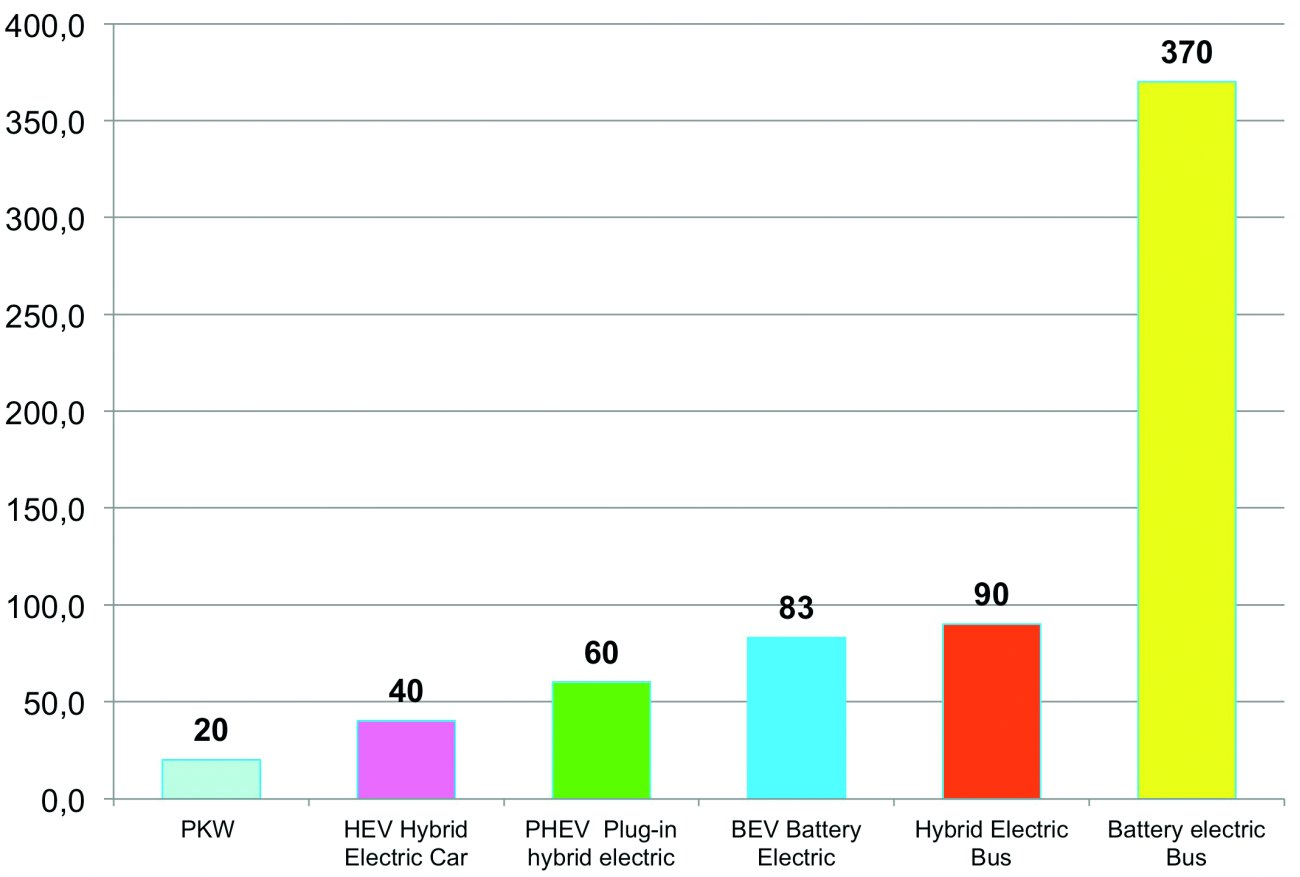 Fig. 7: Average copper demand per vehicle type in kg (source: Friedrichkeit; Copper Development Assoc)
Until the end of the 1990s, the price of copper hovered around 1500 to 2000 $/t for decades. The development of the new infrastructure in China from a developing country to an industrialized country and capital investors caused the price to jump to between 6000 and 7500 $/t.
Figure 8 shows how strong the influence of capital investors is. The copper price in $ per pound and the oil price in $ per barrel (blue) from 1989 to 2021 show parallels, as both are cyclical commodities for capital investors and traders.
In a world of easy money, speculation in commodities is ubiquitous. The sharp rise in inflows into copper ETFs began when central banks stepped on the gas - resulting in the highest copper price in 10 years at over $10,000/t(Fig. 9).
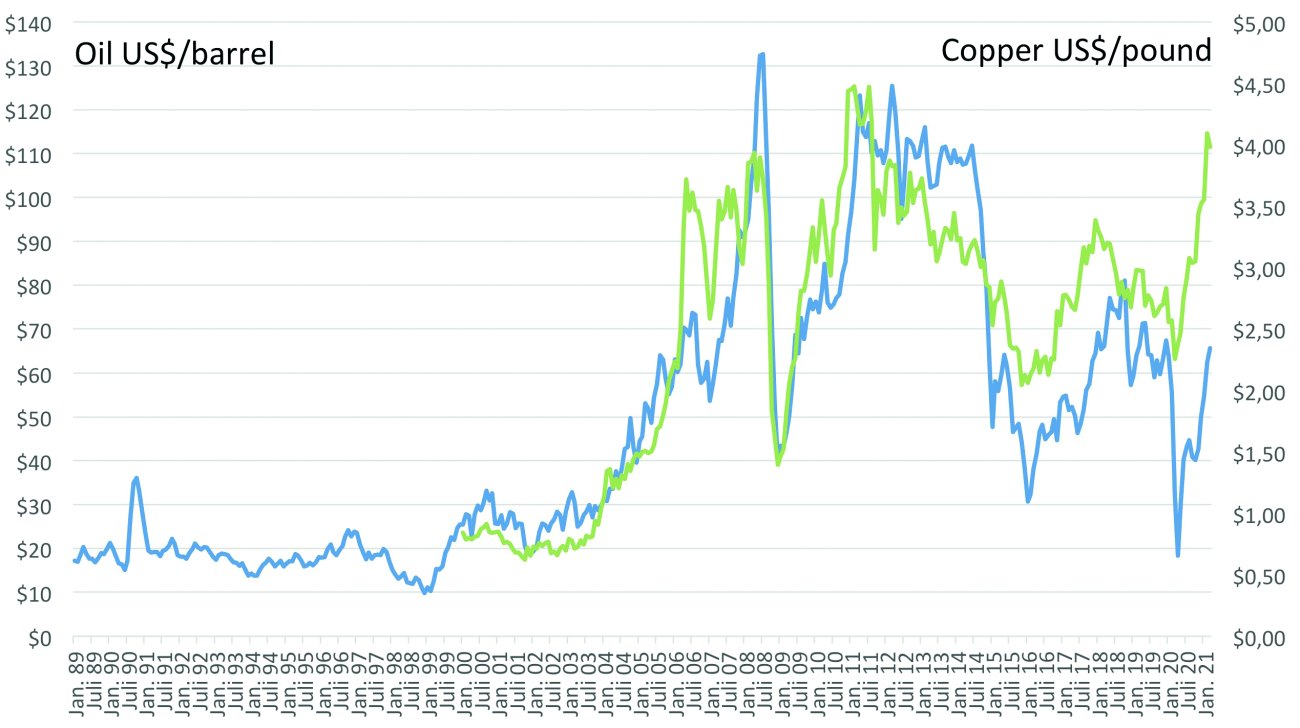 Fig. 8: Copper price in US$/pound (green) and oil price in US$/barrel (blue) 1989 to 2021 show parallels
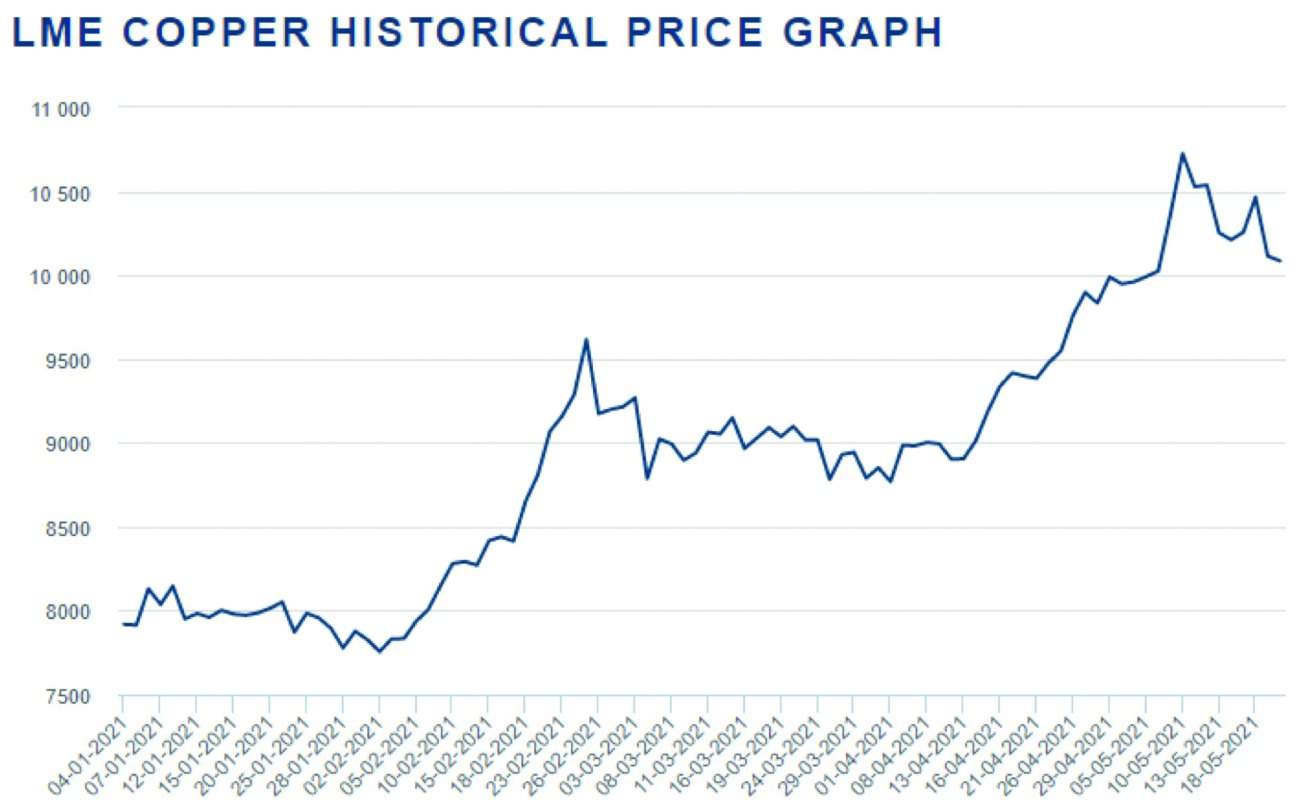 Fig. 9: Copper price trend (cash buyer) from 1.01.2021 to 18.05.2021 (source: London Metal Exchange)
Backwardation?
The copper futures curve(Fig. 10) is in backwardation, i.e. the futures prices are below the cash prices, which is a sign of physical scarcity. Backwardation usually occurs when the demand for immediate delivery of the product is significantly higher than the demand for future forward contracts or futures.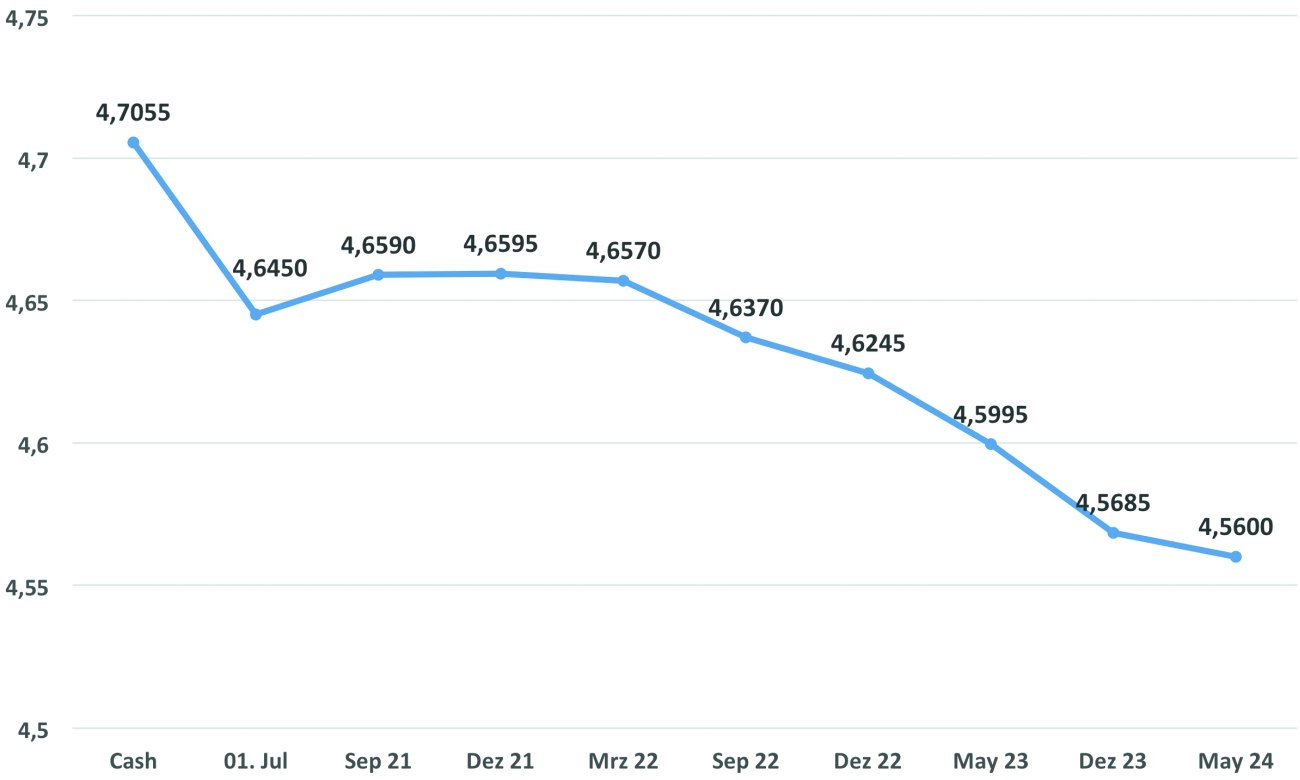 Fig. 10: Copper futures curve on May 14, 2021, closing price in US$/pound on the Chicago Metal Exchange (Graphic: Friedrichkeit)
It is likely that the current copper shortage will prove to be structural, partly because the electrification of the global car fleet and digitalization are accelerating. We should therefore prepare ourselves for a price level of around 10,000 $/t.
In a nutshell
- At 5.7 million tons, Chile produces 29% of the world's copper, followed by Peru with 2.2 million tons, China with 1.7 million tons and Congo with 1.3 million tons
- According to the US Geological Survey, today's known reserves of copper ore amount to 870 million tons and would last for around 40 years if consumption remained constant
- China and Southeast Asia consume around 70 % of the world production of 20 million tons of copper, Europe 17 % and the USA 12 %
- 76% of global copper production goes to the technical equipment (31% equipment), building and civil engineering (29% building/construction) and infrastructure (16% infrastructure) segments
- Electromobility with battery production, the electric motor, the high-voltage grid and power electronics, together with digitalization, are driving copper consumption and therefore prices.
Progress comes at a price, not least because there is far too often a lack of impact assessment. Environmental destruction and terrible working conditions beyond our sight are often the result of massive consumption of raw materials.
