As part of an Industrial Collective Research (IGF) research project, functional layers based on intrinsically conductive polymers are to be developed in order to produce simple and inexpensive breakthrough detectors with electrochemically active surfaces for the AMC contaminants ammonia and formaldehyde. In filter systems for the cleanroom area of semiconductor or microelectronics production, for example, this detector could achieve advantages in terms of improving the quality of the air in the production area by improving sensitivity and selectivity, as well as having a positive impact on costs and sustainability.
Within the scope of a research project of the Industrielle Gemeinschaftsforschung (IGF), functional layers based on intrinsically conductive polymers are developed in order to produce simply constructed and inexpensively manufactural breakthrough detectors with electrochemically active surfaces for the AMC contaminants ammonia and formaldehyde. For filter systems used in the clean-air area of semiconductor or microelectronics production, this detector could have advantages in terms of improving the quality of the air in the production area by improving sensitivity and selectivity, as well as having a positive effect on cost savings and sustainability.
1 Introduction
Due to increasing requirements for clean production environments, the focus in cleanroom technology is on reducing chemical contamination (Airborne Molecular Contamination - AMC) in the room air. The AMC filters used for this purpose consist of various activated carbons or ion exchangers with limited absorption capacity. A breakthrough occurs unnoticed if the material is overloaded and can lead to considerable production losses. AMC filters must therefore be replaced at regular intervals as a precautionary measure before the end of their possible service life. This results in high costs and large quantities of waste. As AMC filters are relatively expensive special products, considerable potential savings can be made, which makes their implementation in marketable products very promising. As cleanroom filters are used in a wide variety of sectors, such as the semiconductor industry, the pharmaceutical and life science industry, microelectronics, optics, cosmetics and food production as well as genetic engineering and medical technology, the corresponding market and application potential is huge.
Commercially available gas sensors are usually robust electrochemical sensors (ECS) consisting of two or three electrodes and an ion-conducting electrolyte. The electrochemical conversion of the working gases takes place at the working electrode. The electrons released flow to the counter electrode via an external circuit and lead to a measurable current flow that is proportional to the amount of gas converted. The charge is balanced by diffusion of the resulting ions through the ion-conducting electrolyte. However, sensors of this type require complex and expensive electronic peripherals for signal evaluation. The detection limits specified by the sensor manufacturers only apply under constant ambient air conditions. Uncompensated fluctuations in temperature and relative humidity generally lead to a considerable increase in the detection limit. The more cost-effective alternative to ECS sensors are metal oxide sensors based on the measuring principle of chemisorption (CS). These use the change in electrical resistance as a function of the gas concentration present. However, this dependence is not linear and is also strongly influenced by ambient conditions and ageing drift. This means that complex calibration work is required before MOX sensors can be used. In contrast to ECS sensors, however, MOX sensors can be evaluated using simple bridge circuits. Mobile MOX sensors, e.g. for monitoring indoor air quality, generally have higher detection limits than the detection systems planned here. The detection limits of mobile MOX sensors for NH3 are in the range of approx. 1 ppm.
The detection limits achieved in the predecessor project AiF IGF 18182N [1] were for SO2: 17.4 mg/m3, NH3: 9.58 mg/m3 and HCl: 5.4 mg/m3. Relevant threshold values for gas contaminants are 14 mg/m3 (20 ppm) for NH3 as a workplace limit value and in accordance with the Animal Welfare Livestock Farming Ordinance. In outdoor air, it is < 700 µg/m3 (1ppm) [2]. For this reason, detection limits in the single-digit ppm range are aimed for in the context of the work carried out here.
![]() Fig. 1: Polyaniline structure diagram (PANI), n+m=1; x=degree of polymerization [24]In order to increase the sensitivity, selectivity and stability of online gas sensors, intrinsically conductive polymers in particular are being considered as gas-sensitive surfaces in research [3]. These are characterized by the fact that redox reactions between the target gas and the polymer surface can increase the conductivity of the polymer by orders of magnitude up to the conductivity of semiconductors or metals. These conductive polymers include, for example, polyacetylene (PA), poly(p-phenylene) (PPP), polypyrrole (PPy), polythiophene (PTh) and polyaniline (PANI) [4, 5]. In a neutral state, conductive polymers behave similarly to semiconductors. Oxidation of the polymer chain (e.g. by corresponding process gases) increases the conductivity by releasing electrons (p-semiconducting). When the polymer chain is reduced, the conductivity is also increased by absorbing electrons (n-semiconducting). The production of polyaniline (PANI) by electropolymerization and other applications of the polymer are based on its intrinsic conductivity. This results from the electronic structure and its oxidation states. A basic distinction is made between three oxidation states, which can also be distinguished by their different colors (see Figs. 1, 2 and 6) Leucoemeraldine: Here, all molecular structures in the chain correspond to the aniline structure with an amine bond, i.e. in the structural formula n = 1 and m = 0. This is the fully reduced form and is not conductive.
Fig. 1: Polyaniline structure diagram (PANI), n+m=1; x=degree of polymerization [24]In order to increase the sensitivity, selectivity and stability of online gas sensors, intrinsically conductive polymers in particular are being considered as gas-sensitive surfaces in research [3]. These are characterized by the fact that redox reactions between the target gas and the polymer surface can increase the conductivity of the polymer by orders of magnitude up to the conductivity of semiconductors or metals. These conductive polymers include, for example, polyacetylene (PA), poly(p-phenylene) (PPP), polypyrrole (PPy), polythiophene (PTh) and polyaniline (PANI) [4, 5]. In a neutral state, conductive polymers behave similarly to semiconductors. Oxidation of the polymer chain (e.g. by corresponding process gases) increases the conductivity by releasing electrons (p-semiconducting). When the polymer chain is reduced, the conductivity is also increased by absorbing electrons (n-semiconducting). The production of polyaniline (PANI) by electropolymerization and other applications of the polymer are based on its intrinsic conductivity. This results from the electronic structure and its oxidation states. A basic distinction is made between three oxidation states, which can also be distinguished by their different colors (see Figs. 1, 2 and 6) Leucoemeraldine: Here, all molecular structures in the chain correspond to the aniline structure with an amine bond, i.e. in the structural formula n = 1 and m = 0. This is the fully reduced form and is not conductive.
Pernigraniline: In this fully oxidized form, n = 0 and m = 1, and all nitrogen bonds are present as imines.
 Fig. 2: Reaction scheme for polymerization [25]Emeraldine: In neutral form also known as Emeraldine base, in doped form after addition of acid as Emeraldine salt (see Fig. 2). The imine nitrogens - if present, since n = m = 0.5 - are protonated by the acid [6]. In this form, PANI is suitable for applications that require electronic conductivity, e.g. the production of conductive coatings, for corrosion protection and for electrochromic applications. The polymerization reaction of aniline is an electrophilic substitution while retaining the aromatic structure. It takes place via a radical cation intermediate [7].
All conductive polymers are sensitive to redox-active gases and some, such as polyaniline or polypyrrole, are also sensitive to acids and bases. The sensitivity and selectivity of conductive polymers can be adapted to the desired target gas by combining them with other polymers or with metal and metal oxide nanoparticles [8-10]. Current work on gas sensors for the quantitative measurement of ammonia and formaldehyde concentrations as well as for other target gases is described in the literature [12-23]. Various modifications of semiconductor surfaces and conductive polymers as well as combinations of both materials are being investigated as gas-sensitive surfaces. The detection limits achieved range from a few ppm to the upper ppb range.
- Electron-absorbing gases (e.g. H2S, NO2, SO2)
- Electron-emitting gases (e.g. CO, NH3)
As part of the project, several conductive polymers were combined with different metal particles and deposited as hybrid layers. The aim was to achieve the most selective and sensitive layer possible for gas detection. The metals can be pure metals, metal oxides or metal alloys. Various electrochemical options are available for this purpose. In this publication, the focus is on optimizing the electrochemical deposition of polyaniline for ammonia detection. The aim here was to produce gas-sensitive coatings with good adhesion and reproducibility.
The project partners at the Institute of Energy and Environmental Technology (IUTA) were responsible for setting up the testing and measurement technology and for developing the evaluation electronics, which were implemented on commercially available sensors as a reference for the detector surfaces to be developed.
2 Experimental substrates used
In order to determine only the influence of the polymer layer in the measurements, insulating material was used as a substrate. Nevertheless, a basic conductivity via the ITO layer or the gold conductor tracks is necessary and given for the contacting or coating.
On the one hand, glass substrates with an ITO layer were used for preliminary tests.
These were used to investigate various process parameters. For the actual measurements of sensor activity, interdigital electrodes made of glass(Fig. 5) were used as detectors for electrochemically active surfaces. Figures 3-5 show the respective surface morphology of the ITO and gold layers under a scanning electron microscope.
 Fig. 3: Surface of ITO layer
 Fig. 4: Surface of gold PVD layer
") Fig. 5: Surface of the gold layer of the interdigital electrode (IDE)
Fig. 5: Surface of the gold layer of the interdigital electrode (IDE)
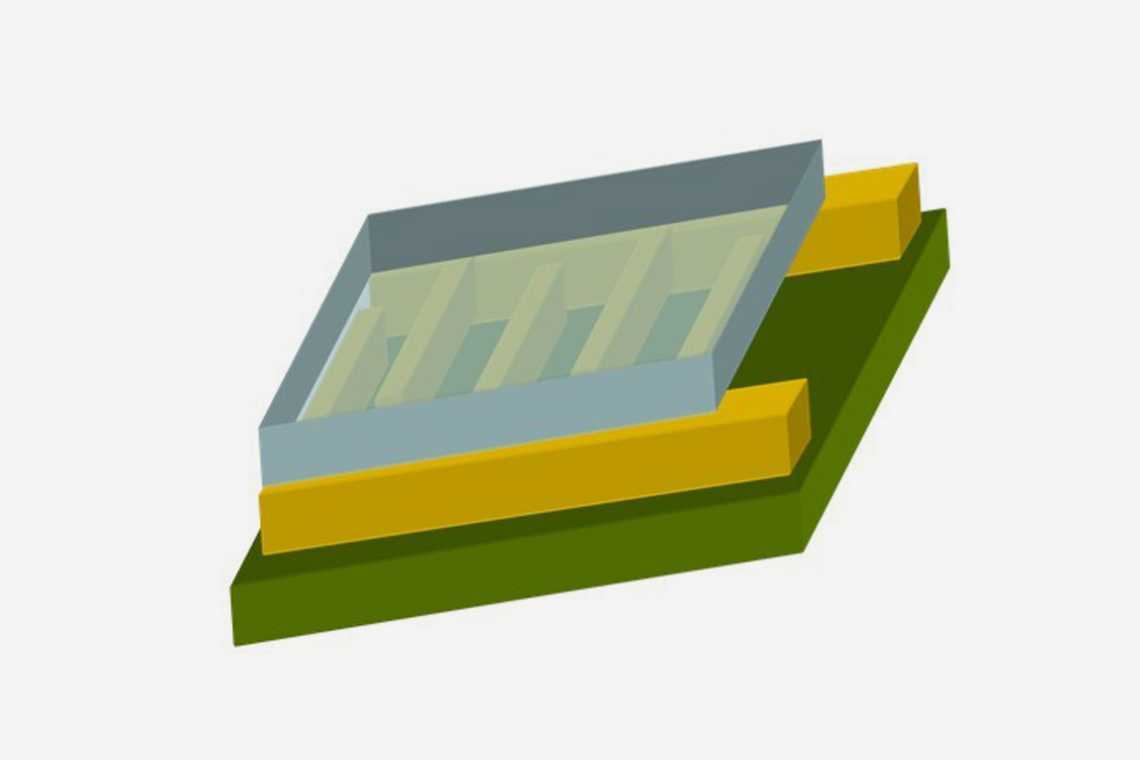
The basic structure of the detector to be developed is shown in the lead image. It consists of a carrier layer (green, insulator), an interdigital electrode (yellow, gold) and the electrochemically produced gas-sensitive layer (gray, polymer).
The deposition area and thus the size of the substrate was 2-4 cm2, depending on the substrate used. The electrodes were arranged vertically and parallel to the anode (Pt wire/sheet metal).
The substrates were pretreated with ethanol prior to electrochemical deposition and, in later experiments, additionally conditioned in 1M sulphuric acid by applying a cyclic potential between -0.2 and 1.5 V (vs Ag/AgCl).
Devices used / deposition conditions
A solution of 0.5M aniline and 1M sulphuric acid was used as the electrolyte for the electrochemical deposition experiments. This is a clear solution. The deposition was carried out with an electrolyte volume of 50-100 ml at room temperature (approx. 18-22 °C). As a post-treatment, the samples were immersed in deionized water and air-dried or rinsed with deionized water and dried using compressed air.
Cyclic voltammetry and chronopotentiometry were used as current modulation for the electrochemical deposition tests and investigations. A Biologic SP150 potentiostat with a 20 A amplifier under the control of the EC-Lab software was used for this purpose. All experiments were carried out using a three-electrode arrangement with a saturated Ag/AgCl electrode as a reference electrode. The first deposition experiments were carried out potentiostatically. A platinum wire was used as the counter electrode. Potentiodynamic experiments were carried out to further optimize the layer properties. For this purpose, a potential between -0.2 V and 0.8 V was applied for a different number of cycles at a feed rate of 50 mV/s. Care must be taken to ensure that both oxidation states of the polymer are within the reaction window for successful electropolymerization of the aniline. Further restructuring of the polymer chain can take place during the back-scan.
As already explained, the different oxidation states of the polyaniline differ in color. Figure 6 b-e shows the polymer layers at different potentials and thus oxidation states.
 klar – ITO-Glas") a) clear - ITO glass
a) clear - ITO glass
 gelb – Leukoemeraldin") b) yellow - leucoemeraldine
b) yellow - leucoemeraldine
 grün – Emeraldin") c) green - Emeraldine
c) green - Emeraldine
 blau – Pernigranilin") d) blue - pernigraniline
d) blue - pernigraniline
 schwarz – Polymer zersetzt") e) black - polymer decomposed
e) black - polymer decomposed
Fig. 6: Color representation of the oxidation states
Various substrates were coated during the course of the project. Initially, ITO glass substrates were used. The electrochemical experiments were then carried out on flat gold layers. After characterization and evaluation of the layers on the fem using SEM, FIB, conductivity measurements and adhesion strength, the most promising systems were transferred to the interdigital electrodes. These were made available to the project partner IUTA for the measurements in order to verify their function and suitability as an electrochemically active surface for the detection of the intended gases.
The results of the potentiostatic and potentiodynamic electropolymerization of the aniline are discussed below. A commercially spin-coated polyaniline layer is used as a reference.
Potentiostatic deposition
For the potentiostatic deposition experiments, the potential range between 0.7-0.85 V and the deposition time were varied and the corresponding coatings were characterized. The most promising systems were given to the IUTA for characterization as a possible detector system. Figure 7 shows the current curve at 0.8 V over 30 and 60 seconds. It shows the current-time curve of three samples with identical deposition conditions. The samples produced were examined for reproducibility.
 Fig. 7: Curve orange blue: 0.85V, 30 and 60 sec; optimized samples - short curve red green yellow, potentiostatic 0.85V
Potentiodynamic deposition
For the potentiodynamic experiments, a potential range of -0.2 V to 0.8 V vs. Ag/AgCl was cycled at a feed rate of 50 mV/s. A corresponding cyclic voltammogram is shown in Figure 8. Here, the first oxidation at about 0.2 V vs. Ag/AgCl corresponds to the conversion from leucoemeraldine to emeraldine and the color of the polymer layer changes from yellow to green. Further oxidation to pernigraniline takes place from about 0.75 V and the polyaniline turns blue.
 in H2So4 (1.0 M); blaue Kurven: Potentiodynamisch, Cyclovoltagramm 50 Zyklen, 50V/S") Fig. 8: Orange curve; cyclic voltammogram of the electropolymerization of aniline on ITO glass (0.5 M) in H2So4 (1.0 M); blue curves: potentiodynamic, cyclic voltammogram 50 cycles, 50V/S
Fig. 8: Orange curve; cyclic voltammogram of the electropolymerization of aniline on ITO glass (0.5 M) in H2So4 (1.0 M); blue curves: potentiodynamic, cyclic voltammogram 50 cycles, 50V/S
The conductivity of the PANI is highest between these two potentials. From 0.9 V, a steep increase in current leads to decomposition of the polymer [27](Fig. 6e). The hydrolysis products lead to a non-adhesive, matt and velvety polymer surface.
In Figure 8, 50 cycles were used for an electropolymerization. The increasing layer thickness leads to a significant increase in the amount of charge converted per cycle and thus the height of the reduction and oxidation peaks. Figure 9 shows three curves (cycle 40 in each case) of identically produced samples for comparison. The main aim here is to assess the reproducibility. The corresponding samples show a very similar curve and were sent to the IUTA for further characterization.
 Fig. 9: Potentiodynamic, cycle 40 shown, 50 mV/s
The results
A selection of the polymer layers produced on different substrates is shown in Figures 10-12. Figure 13 shows the optimized samples of the potentiostatic deposition after a reproducibility check (see Fig. 7). These were then measured at the IUTA. Figure 14 shows the same for the potentiodynamic production variant. The sample in Figure 12 served as a reference.
 Fig. 10: ITO coated, electrochemical
 Fig. 11: IDE coated, electrochemical
 Fig. 12: IDE coated, spin coating
 Fig. 13: Samples with the same deposition conditions - reproducibility EC, coating thickness approx. 0.5-1 μm, Figure 7
 Fig. 14: Problem produced cyclically, reproducible deposition, Z4, Z5 and Z7, layer thickness approx. 150 nm, Figure 9
Characterizations
The images on the scanning electron microscope and the EDX measurements were carried out with the FE-SEM Gemini SEM 300 and FIB Auriga 60 from Zeiss.
Figures 15 and 16 show various scanning electron microscope images of the potentiostatic(15 a-c) and potentiodynamic layers(Fig. 16 a-c).
The surface images in the overview(Fig. 15 a) and in detail(Fig. 15 b) of the potentiostatic deposition show fibrinogenic growth (loose network of polymer fibers).
The cyclic deposition shows a completely different surface morphology as an overview(Fig. 16 a) and in detail(Fig. 16 b). The up to 200 nm globular growth (individual round nuclei) forms a compact polymer layer.
In the FIB section(Fig. 15 c and 16 c), the layer structure and the layer thickness of the polymer can be determined as well as the ability to overgrow the glass surface between the gold conductor tracks.
Due to the production process, some interdigital electrodes have gold tracks that protrude at the end like a 'chip' (see Fig. 15 c and 16 c). This must be overgrown by the polymer in order to create a conductive connection to the next gold conductor track.
As a comparison to the electrochemically produced samples in Figures 15 and 16, reference coatings were used which were produced with a commercial polyaniline-based lacquer (Allresist) using spin coating. Homogeneous layer thicknesses between 20-50 nm can be applied to IDE and ITO. The layer was documented using a FIB layer (see Fig. 17 a-d).
 Übersicht IDE, Polymernetzwerk") a) Overview of IDE, polymer network
a) Overview of IDE, polymer network
 Detail Polymerschicht Fibrillenstruktur") b) Detail of polymer layer fibril structure
b) Detail of polymer layer fibril structure
 FIB-Schnitt, Schichtdicke ca. 0,5-1 μm") c) FIB section, layer thickness approx. 0.5-1 μm
c) FIB section, layer thickness approx. 0.5-1 μm
Fig. 15: Potentiostatic
 Übersicht IDE, Polymerschicht") a) Overview IDE, polymer layer
a) Overview IDE, polymer layer
 Detail Polymerschicht globulär") b) Detail of globular polymer layer
b) Detail of globular polymer layer
 FIB-Schnitt, Schichtdicke 150 nm") c) FIB section, layer thickness 150 nm
c) FIB section, layer thickness 150 nm
Fig. 16: Potentiodynamic
 50 nm homogene Polymerschicht, IDE") a) 50 nm homogeneous polymer layer, IDE
a) 50 nm homogeneous polymer layer, IDE
 20 nm homogene Polymerschicht, ITO") b) 20 nm homogeneous polymer layer, ITO
b) 20 nm homogeneous polymer layer, ITO
 Detail IDE") c) Detail IDE
c) Detail IDE
 Detail ITO") d) Detail ITO
d) Detail ITO
Fig. 17
Test stand for gas measurement
The test stands consist of a test chamber through which gas can flow, with gas connections for the supply and removal of test gases. In the area of an outer surface, the gas-sensitive surfaces to be tested are integrated gas-tight and electrically contacted. Reference gas sensors as well as humidity and temperature sensors are also installed in this area. The test gas is dosed via flow-regulating mass flow controllers from several pressurized gas cylinders with synthetic air and test gases. The relative humidity of the test volume flow of 1 l/min is regulated via an evaporator with droplet separator. Alternatively, air-conditioned room air is used.
The functionality of the test stands was verified by integrated reference gas sensors. The integrated sensors from Amphenol SGX Sensortech, model MiCS-6814, are designed for the target gases NH3 (1-500 ppm), NO2 (0.05-10 ppm) and CO (1-1000 ppm) or the model MiCS-5914 for NH3 only. Relative humidity and temperature are measured using the BME280 sensor from Bosch Sensortec.
Evaluation
The gas-sensitive surfaces to be developed and the reference gas sensors require the acquisition of the primary sensor signals, the resistance changes and their conversion into an output voltage by external evaluation electronics to be developed. This consists, for example, of a voltage divider with the variable resistance of the sensor and a load resistor in the order of magnitude of the basic resistance of the sensor when zero gas is applied. More complex circuits use operational amplifiers and work with a constant potential in order to detect even small target gas concentrations. To compensate for cross-sensitivities, in this case temperature and relative humidity, "mathematical compensation" was investigated by experimentally determining the functional relationships for the respective interference components. From these results, the function of the concentration of the target gas was derived as a function of the changes in the sensor resistance and the interfering components. The evaluation electronics developed (hardware and software) were tested on the MiCS-5914 sensor under calibration conditions (T = 20 ± 2 °C and RH = 50 ± 5 %) and their intended function was verified by comparing the measured values determined with the manufacturer's specifications. The tests for compensation of the cross-sensitivities (T, r. H.) provided linearized functions of the relative resistances as a function of the change in temperature or relative humidity. Through further mathematical transformations, the functional relationship between the test gas concentration to be measured as a function of the cross-sensitivities can be specified in general form(equation 1):
Equation 1:
CGas (ΔR/R0, ∆T, ∆φ) = (1/(1+ β∆φ))1/ϑ x
(1/(1+ α∆T))1/ϑ x (1/A)1/ϑ x (1+∆R/R0)1/ϑ with:
R0 = R(T0, φ0, C0)
C0 = zero gas concentration
α = temperature coefficient, dependent on material
β = Parameter for moisture influence
ϑ = Slope of the R-curve under gas exposure
A = Constant, material-dependent
By compensating for cross-sensitivities (T and r. F.), it is now also possible to carry out investigations into the sensor response under extended ambient conditions. The basic resistances R0 were determined in each case and suitable samples were exposed to the test gas ammonia in order to determine the sensor response and characteristic values such as response and recovery time. Basic resistances of less than 100 kW up to several 100 kW were achieved. As expected, the associated relative resistance changes with a dosage of 10 ppm ammonia over a period of around 5 minutes only showed a small sensor response of a few percentage points for a relatively small basic resistance of 32 kW. A sample with the larger basic resistance of 500 kW led to a sensor response of over 30 % points.
Figure 18 shows that further optimization of the sample preparation (different treatments) prior to gas exposure results in larger sensor responses and shorter recovery times. Compared to the reference gas sensor, similarly steep rise and recovery slopes are achieved. After the end of the dosing of the test gas, the relative change in resistance does not fall back to the zero line, but assumes a stationary value, as with a dosimeter with integrating behavior.
 Fig. 18: Relative change in resistance when dosing 2.5 and 5 and ppm ammonia for three samples compared to the reference sensor
Overall, the potentiostatically deposited samples had to be pretreated before the test to ensure a homogeneous coating surface. This was the only way to obtain a measurement signal at all. This was no longer necessary for the potentiodynamically deposited samples, as these surfaces are directly suitable as detectors.
By changing the deposition conditions during the course of the project, it was possible to achieve the zero line. The results in Figure 19 show that the potentiostatically deposited samples as well as the spin coated samples have comparable response times to the reference sensor, but the sensor response is significantly lower depending on the gas concentration (0.5 ppm, 2.5 ppm and 5 ppm ammonia). Figure 19 shows that, depending on the basic resistance of the potentiodynamically deposited samples, the samples produced are comparable to the reference sensor at the 5 ppm ammonia concentration. The recovery time is slightly longer. At lower concentrations of 2.5 and 0.5 ppm, the sensitivity is still lacking. Here the sensor response is too low at less than 20 %. The response time is acceptable compared to gas exposure.
 Fig. 19: Resistance change vs. NH3 concentration 0, m5 ppm, 2.5 ppm at T 24 °C, rH 31 %
Summary & outlook
During the course of the project, it was shown that conductive polymers can be electrochemically deposited on various substrates using different current modulations and that the layers produced are suitable as electrochemically active surfaces. The challenge is to produce thin polymer layers in the 100 nm range which nevertheless close the 10 µm gap between the conductive tracks. In the potentiostatically deposited samples, a fine compact polymer layer forms directly on the substrate, followed by a loose polymer network with low adhesion. This does not provide satisfactory measurement signals without pre-treatment. With the layers produced with spin coating, measurement signals can be tapped directly, but the sensitivity is too low. The best results to date as electrochemically active surfaces are shown by the potentiodynamically deposited samples, as these provide similar sensitivity to a MOX sensor at concentrations of 5 ppm ammonia.
In summary, a detection system was set up and demonstrated at IUTA and sufficient sensitivity was achieved for the gas ammonia using electrochemically active surfaces. Further tests to optimize the polymer layers and selectivity are currently being carried out.
Acknowledgements
The IGF project 21279 N of the Forschungsvereinigung Edelmetalle + Metallchemie is funded via the AiF within the framework of the program for the promotion of joint industrial research (IGF) by the Federal Ministry of Economics and Climate Protection on the basis of a resolution of the German Bundestag.term: 01.08.2020-31.01.2023 extended until 07/23
Graphic material
All graphics, illustrations and photos: fem
Literature
AMC Control AiF IGF project 18182N
https://www.air-q.com/messwerte/ammoniak, Retrieved 24.2.2023
e. a. Seon Joo Park: Chemo-Electrical gas sensors based on conducting polymer hybrids, polymers, 09 2017
M. Schneider, qucosa.de: Polythiophenes as sensitive films in chemical sensors, 2002, [online], Available: http://www.qucosa.de/fileadmin/data/qucosa/documents/1005/1042708889359-4281.pdf [accessed 27.8.2019]
H. Bai; G. Shi: Gas Sensors Based on Conducting Polymers, Sensors, Vol. 7, 2007, 267-307
M. K. et al: Gold in Polyaniline: recent trends, Gold Bulletin, 4, 2009, 166
S. W. et al.: Electrical and electrochemical properties of electronically conducting polymers, in applications of electroactive polymers, B. Scrosati, Chapman&Hall, 1993, p. Chapter 2
T. S. et al.: Thin functional conducting polymer films - preparation, properties and applications, Mainz: Dissertation, 2005
U. Lange; V.M. Mirsky: Leitfähige Polymere in Chemo- und Biosensoren, 10.3.2011, [online], Available: https://analytik.news/Fachartikel/Volltext/hs-lausitz1.pdf,[accessed on 27. 8.2019]
S. Pandey: Highly sensitive and selective chemiresistor gas/vapor sensors based on polyaniline nanocomposite: A comprehensive review, Journal of Science: Advanced Materials and Devices, vol. 1, 2016, 431-453
S.J. Park; C.S. Park; H. Yoon: Chemo-Electrical Gas Sensors Based on Conducting Polymer Hybrids, Polymers, vol. 9, 2017
N.J. Choi; H.K. Lee; S.E. Moon; W.S. Yang: Fast response formaldehyde gas sensor for USN application, 4-7, 9, 2011, [online], Available: https://www.sciencedirect.com/science/article/pii/S1877705811059339,[accessed 27.8.2019]
U. Cindemir; Z. Topalian; L. Österlund; C.G. Granqvist; G.A. Niklasson: Porous Nickel Oxide Film Sensor for Formaldehyde, Journal of Physics: Conference Series, No. 559 012012, 2014
K. Darcovich; J.J. Tunney; J.L. Dunford; L.M. Styles; G. Xiao; A. Constant: Coupled Gas Flow, Diffusion and Reaction in a ppb-level SnO2-NiO Formaldehyde Sensor System,Int. Jnl. of Multiphysics, Vol. 5, No. 2, 2011, 101-114
F. Fang; L. Bai; D. Song; H. Yang; X. Sun; H. Sun; J. Zhu: Ag-Modified In2O3/ZnO Nanobundles with High Formaldehyde Gas-Sensing Performance,Sensors, vol. 15, 2015, 20086-20096
J. Flueckiger; F.K. Ko; K.C. Cheung; Microfabricated Formaldehyde Gas Sensors, Sensors, vol. 9, 2009, 9196-9215
R. Hu; J. Wang; P. Chen; Y. Hao; C. Zhang; X. Li: Preparation of Cd-Loaded In2O3 Hollow Nanofibers by Electrospinning and Improvement of Formaldehyde Sensing Performance, Journal of Nanomaterials, No. Article ID 431956, 2014
P. Gaudillat; F. Jurin; B. Lakard; C. Buron; J.M. Suisse; M. Bouvet: From the Solution Processing of Hydrophilic Molecules to Polymer-Phthalocyanine Hybrid Materials for Ammonia Sensing in High Humidity Atmospheres, Sensors, Vol. 14, 2014, 13476-13495
A. Marikutsa; M. Rumyantseva; A. Gaskov: Selectivity of Catalytically Modified Tin Dioxide to CO and NH3 Gas Mixtures, Chemosensors, vol. 3, 2015, 241-252
Q. Wang; X. Dong; Z. Pang; Y. Du; X. Xia; Q. Wei; F. Huang: Ammonia Sensing Behaviors of TiO2-PANI/PA6 Composite Nanofibers, Sensors, vol. 12, 2012, 17046-17057
A. Yadav; A. Agarwal; P.B. Agarwal; P. Saini: Ammonia Sensing by PANI-DBSA Based Gas Sensor Exploiting Kelvin Probe Technique,Journal of Nanoparticles, No. Article ID 842536, 2015
M. Leidinger; T. Sauerwald; W. Reimringer; G. Ventura; A. Schütze: Selective detection of hazardous VOCs for indoor air quality applications using a virtual gas sensor array, J. Sens. Sens. Syst. vol. 3, 2014, 253-263
M. Rodner; D. Puglisi; S. Ekeroth; U. Helmersson; I. Shtepliuk; R. Yakimova; A. Skallberg; K. Uvdal; A. Schütze; J. Eriksson: Graphene Decorated with Iron Oxide Nanoparticles for Highly Sensitive Interaction with Volatile Organic Compounds, Sensors, Vol. 19, 2019
https://de.wikipedia.org/wiki/Polyanilin#/media/Datei:Polyaniline_structure.svg; accessed 07.03.2023.
Michal Bláha et al.: Structure and properties of polyaniline interacting with H-phosphonates, Synthetic Metals, Volume 232, October 2017, 79-86
T. Kurzenknabe: Microstructured sensors for pH value determination based on thin, intrinsically conductive polyaniline layers, Dissertation, 2003
S. Tian: Thin Functional Conducting Polymer Films - Preparation, Properties and Applications, Dissertation, 2005
