3.2 Rheological properties
A rotational viscometer (MCR301, Anton Parr) was used to investigate the influence of the type and concentration of the gel former and the electrolyte components on the rheological properties of the gels. For this purpose, oscillation tests were carried out on a circular gel (Ø 20 mm, thickness 3 mm) in a so-called plate-plate setup, in which the deformation was gradually increased from 0.01 to 100 % at a circular frequency of 10 rad/s (1.6 Hz). The parameters gel concentration and NaCl content were varied as well as variations of agar and agarose depending on the pH value of the electrolyte (alkaline, neutral, acidic).
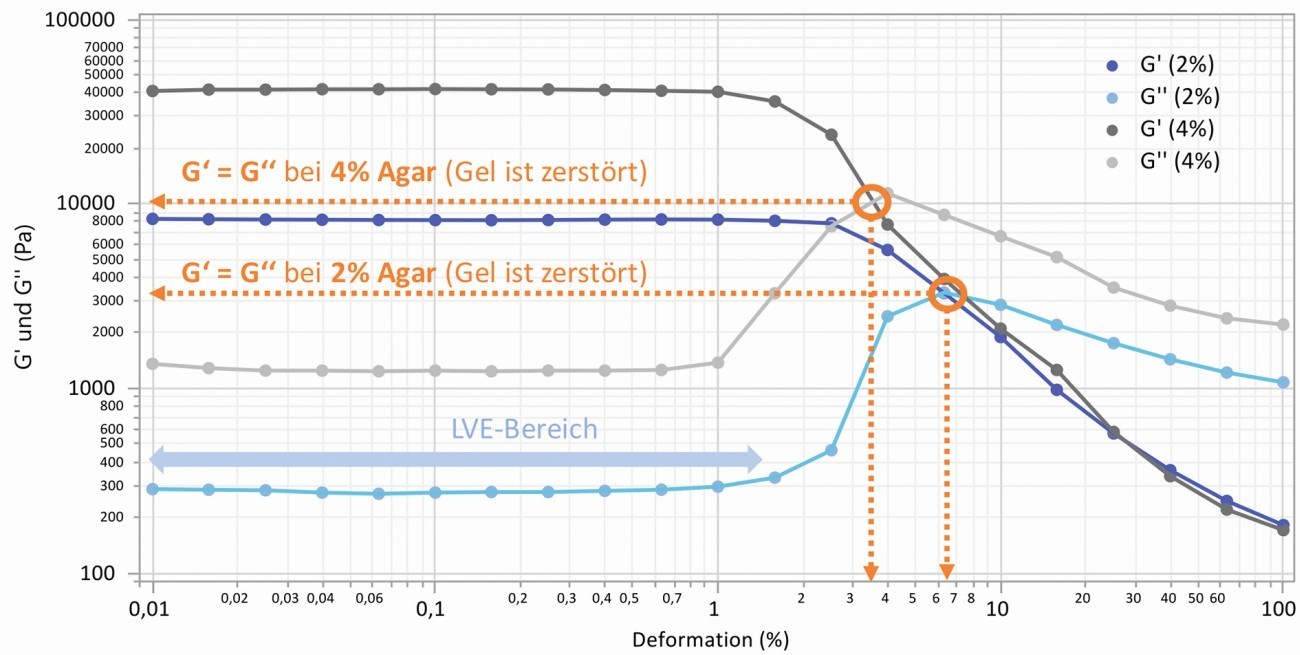
As a result of the measurements, the curves of the storage modulus G' for the elastic behavior and the loss modulus G'' for the viscous behavior over the deformation are obtained, from which further characteristic values can be determined or calculated. For example, the size of the moduli in the plateau area, the permissible elastic deformation and the so-called crossover point (yield stress at G' = G''), at which the course of both moduli intersects and the gel is destroyed. The quotient of G'' and G' is referred to as the loss factor and is characteristic of the visco-elastic behavior, which ends with a change in the linear curves above a certain strain (linear visco-elastic range, LVE). For the gels tested, the loss factor is between 0.07 and 0.025, which indicates a predominantly elastic behavior (> 100 = ideally viscous, < 0.01 = ideally elastic). Two typical curves for 2 and 4 % agar (0.1 M NaCl each) are shown in Figure 1.
 Fig. 1: Progression of storage and loss modulus over the deformation using the example of gel samples with 2 and 4 % agar (0.1 M NaCl), labeling of the crossover point (yield stress)
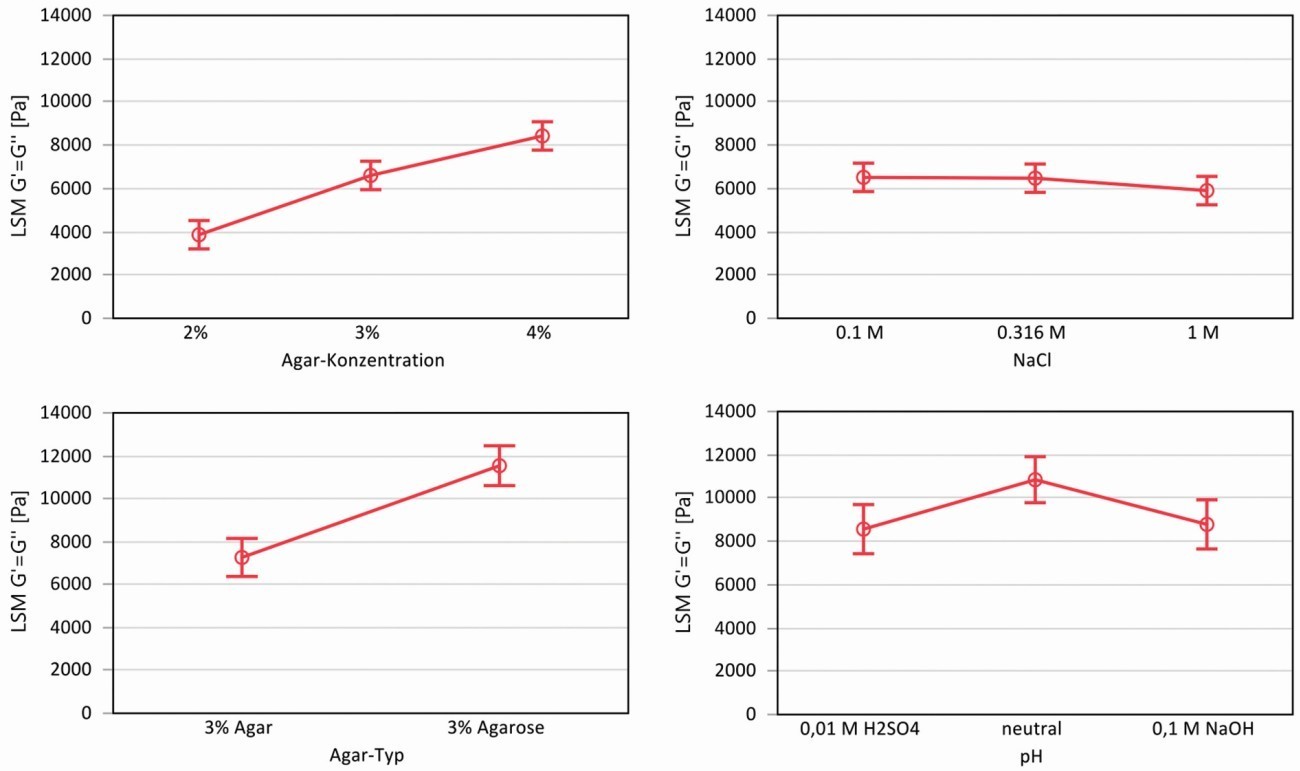
The statistical evaluation of orthogonal planned experiments resulted in the correlations shown in Figure 2, here as an example for the yield stress of the gels. When varying the gel concentration of the agar with the NaCl content, the yield stress showed a strong dependence on the agar concentration, but no significant dependence on the NaCl content. When varying agar and agarose as a function of pH, it can be seen that the agarose allows higher yield stresses than the agar due to the higher proportion of gel former. Both acidic (0.01 M H2SO4) and alkaline electrolytes (0.1 M NaOH) weaken the network and lower yield stresses are measured compared to a neutral gel.
 Fig. 2: Statistical evaluation of the rheological experiments using the least squares method (LSM = Least Squares Mean) for the yield stress (intersection G' and G''), top: Influence of agar concentration and NaCl, bottom: Influence of agar type and pH value
3.3 Electrolyte film on the surface
In order to use gels as electrolytes for corrosion experiments, an ion-conducting phase must be present on their surface. This is the case with agarose-based gels due to the so-called syneresis effect. The solid polymer phase penetrates the aqueous electrolyte and physically causes a certain proportion of the liquid to escape to the surface, where it forms a thin electrolyte film. In order to determine the amount of electrolyte on the surface of the gels, a method for extracting the electrolyte film from the surface was developed that is relatively simple and functional. First, circular gels with a diameter of 15 mm are cut out of a cast gel plate with a thickness of 6 mm. These are placed in a suitable plastic container and weighed using a precision scale. The container with the gel is then placed in a device in which a Whatman Grade 1 filter paper (11 µm pore size) is pressed for 3 seconds at 45 cN (corresponds to a contact pressure of approx. 0.255 N/cm2 in relation to the surface area). This contact pressure is below the yield stress of the gels, which was determined by rheological measurements, and is sufficient to absorb the electrolyte film on the surface of the filter paper without damaging the gel. The gel is then weighed again in the container. The mass difference is proportional to the volume of the removed electrolyte film and can be converted to an equivalent of the electrolyte film thickness, taking into account the geometry and electrolyte density.
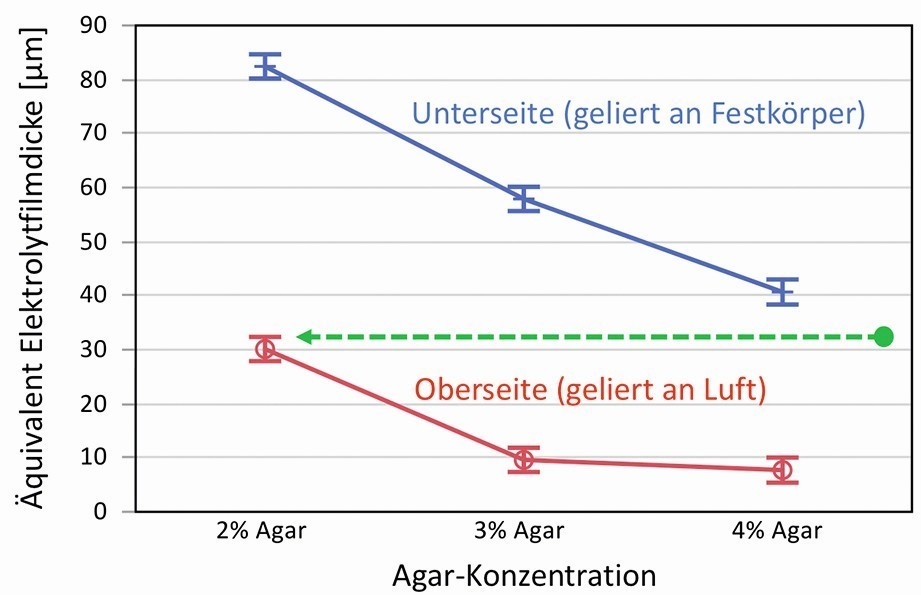
A large number of different gels, with variations in agar concentration and electrolyte components, were investigated in this way. A distinction was also made according to the side on which the gels solidified either in air (top side) or on a solid (bottom side, polished acrylic glass). The factors with the greatest influence were the gel concentration and the solidification side or the surface that is created. Based on the dependence of the electrolyte film thickness on the concentration of the gel former, a strong correlation with the gel network and the pore size is also likely here. Figure 3 shows the equivalents for the electrolyte film thickness as a function of the agar concentration and the side on which the measurement was taken in a diagram.
 Fig. 3: Determined equivalents for electrolyte film thicknesses of agar gels as a function of agar concentration and solidification on air or solid, the meaning of the arrow is explained in the text
One possible explanation as to why the top and bottom surfaces are so different from each other can be derived from the roughness of the surfaces. The gels were poured onto polished acrylic glass in a liquid state and solidified there. They therefore largely adopt the smooth surface profile on the underside. On the upper side, however, they can dry slightly and shrink, as there is virtually no resistance to these processes from the air. This makes the surface somewhat rougher and wavier, which may result in a smaller proportion of the electrolyte film being extracted.
An equally plausible, if not immediately obvious, reason for this behavior lies in the inner gel structure just below the surface. Drying during solidification can cause the polymer fibers to concentrate and lead to a zone with a denser gel network. This was already observed by Labille et al. in 2007 [25]. Using diffusion experiments, it was demonstrated that an approx. 120 µm thick zone exists at the edge of the gel, which has a significantly denser network. According to the authors, an agarose gel with a nominal 1.5 % polymer content at the edge has a diffusion behavior that corresponds to a gel with 5 % agarose and thus a denser network. This finding can be transferred to the relationship in Figure 3 (green arrow). If we assume, for example, that a gel with 2 % agar on the top actually corresponds to a gel with approx. 4.5 % agar, the curves determined fit together very well. It can therefore be seen that as the agarose concentration increases, the equivalent for the electrolyte film thickness continues to decrease, i.e. the leakage of liquid at the surface decreases. It should also be noted that the side solidified in air has a zone with a denser gel network and is therefore somewhat drier.
The influence of different ions on the electrolyte film thickness, on the other hand, is significantly lower and in some cases not statistically relevant. Compared to distilled water as the electrolyte base, acidic and alkaline electrolytes show slightly higher equivalents for the electrolyte film thickness. As with the rheological investigations, the relationship to the gel network and pore size is evident here. The gel network can be slightly weakened by certain ions in the electrolyte, thus increasing the syneresis-related leakage of electrolyte from the gel.
3.4 Mass transport of ions and particles in the gel
The rheological properties and the formation of the electrolyte film show a clear correlation with the gel network, which becomes denser as the gel concentration increases, causing the interstitial spaces (pores) to become smaller. In gel electrophoresis, the different pore sizes are specifically used to identify and separate nucleic acids (molecular sieve). Long-chain compounds, as well as ions and particles, are hindered in their mobility by the gel network depending on their size. The question is to what extent this happens with corrosion-relevant species and what consequences this can have.
For these considerations, one must first consider the size of the corrosion-relevant ion species. If we consider hydronium and hydroxide ions as well as the ions of dissociated salts, these are always surrounded by a hydrate shell, which additionally slows down their movement in the medium. These hydrated ions have radii in the range of 0.2 to 0.5 nm. Reactions of metal cations from corrosion processes with anions in the aqueous electrolyte or dissolved oxygen produce further compounds in the medium (corrosion products), which can adsorb on the metal surface or continue to move freely in the medium. The order of magnitude can increase into the one to two-digit nanometer range and they begin to become optically visible. Even more complex compounds and coagulations of particles must also be considered. For so-called electrographic applications, specific color indications of ion species are of interest, such as in the reaction of potassium ferricyanide with iron ions to form Berlin blue. The well-known color pigment consists of individual particles in the two-digit nanometer range. However, it has a tendency to form ordered superstructures with an extension of several hundred nanometers [26].
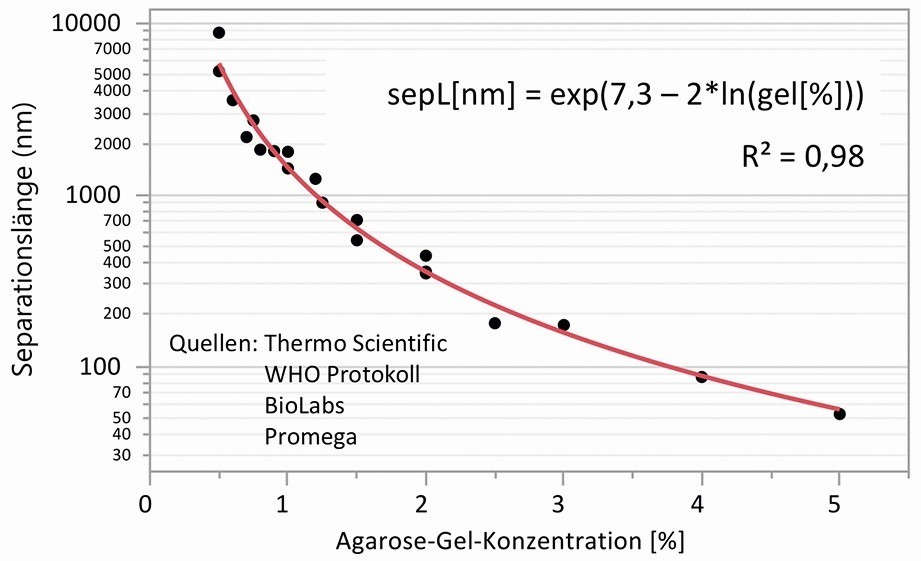
As early as the 1970s, Ogston et al. presented a simple model to estimate the interaction of spherical particles and macromolecules with the microstructure of gels with randomly oriented stiff polymer fibers [27]. In the Ogston mechanism named after him, the fiber volume fraction and the size of the particles in relation to the pore size are taken into account. Applied to gel electrolytes, the loss of diffusivity can be calculated in relation to the pore size and the particle size. However, a formal mathematical relationship between the agarose concentration and pore size could not be found in the literature, as the dependence on the measurement method used is very high. However, a look into the field of agarose gel electrophoresis can help. This is because the numerous suppliers of products give recommendations as to which agarose concentration is optimal for separating a certain number of base pairs. For example, a WHO protocol for performing agarose gel electrophoresis for separating linear DNA suggests a gel concentration of 2.5 % for 50 to 1000 base pairs and 1.5 % for 200 to 4000 base pairs [28]. If the base pair distance of the DNA is set at 0.34 nm, a separation length can be derived from this using regression as a function of the agarose concentration, as shown in Figure 4. The values determined for the mean separation length are in the range of the pore size of the agarose gels. The formal relationship found between separation length or pore size and agarose concentration was used for further calculations.
 Fig. 4: Separation length as an equivalent for the pore size as a function of the agarose gel concentration, data from information and recommendations on agarose gel electrophoresis
Using the formula in Figure 4 , the diffusion inhibition or immobilization according to the Ogston mechanism can now be calculated and visualized for different agarose concentrations and spherical particles of different sizes. Figure 5 shows the diffusion inhibition over the pore size, in each case with curves for different radii of hydrated ions and spherical particles in the size range of corrosion products (5 to 20 nm) and the colour complex "Berlin blue" as an example in the range from 50 to 400 nm. Also marked in the diagram is the pore size range in which differently concentrated agarose gels are located and a range for the pore size of filter paper, which is also frequently used as an electrolyte carrier for ion detection reactions.
![Abb. 5: Visualisierung der Diffusionshemmung unterschiedlich großer sphärischer Teilchen in Abhängigkeit der Porengröße gel-artiger Medien nach Ogston [27] und der Formel in Abbildung 4 Abb. 5: Visualisierung der Diffusionshemmung unterschiedlich großer sphärischer Teilchen in Abhängigkeit der Porengröße gel-artiger Medien nach Ogston [27] und der Formel in Abbildung 4](/images/stories/Abo-2021-12/gt-2021-12-0078.jpg) Fig. 5: Visualization of the diffusion inhibition of spherical particles of different sizes as a function of the pore size of gel-like media according to Ogston [27] and the formula in Figure 4
Fig. 5: Visualization of the diffusion inhibition of spherical particles of different sizes as a function of the pore size of gel-like media according to Ogston [27] and the formula in Figure 4
The diffusion inhibition of hydrated ions up to 1 nm radius is less than 1 % for pore sizes up to approx. 50 nm and can therefore be neglected as an influencing factor for agar gels up to approx. 5 %. The loss of mobility increases for particles with radii in the two-digit nm range (corrosion products) and is between 1 and 10 % for agar gels. This means that a certain degree of immobilization is already present, which can have an effect on corrosion reactions. A longer dwell time of corrosion products in the thin electrolyte film between metal and gel can change the formation of cover layers or passivation processes. The mobility of particles with radii > 50 nm is restricted even more, up to almost complete immobility of particles with radii > 400 nm in agar gels by 3 %. For indicator reactions, such as the detection of iron ions by the formation of Berlin blue, this means that after the reaction the color pigment is retained at the site of the reaction, although it can still move relatively unhindered when using filter papers with pore sizes of 15 to 1.5 µm.
- to be continued -
Literature
[1] Laque, F.L.; May, T.P.; Uhlig, H.H.: Corrosion in Action, International Nickel Company Canada, 1955
[2] Isaacs, H.S.; Adzic, G.; Jeffcoate, C.S.: Visualizing Corrosion, Corrosion 56 (2000) 10, 971-978, https://doi.org/10.5006/1.3294386
[3] DIN EN ISO 10309:2016-08: Metallic coatings - Test method for the determination of porosity - Ferroxyl test (ISO 10309:1994), German version EN ISO 10309:2016
[4] Petersen, P.; Emnéus, H.: The Ferroxyle Test as a General Test of the Corrosiveness of Surgical Appliances Made from Stainless Steel or Co-Based Alloys of Stellite- Type, Mainly Vitallium and Neutrilium, Acta Orthopaedica Scandinavica, 29(1959)1-4, 1959, 331-340, https://doi.org/10.3109/17453675908988808
[5] Lehmann, J.; Burkert, A.; Müller, T.; Bohlmann, T.; Burkert, A.: Final report on the IGF project 17136 N/1 Detection of corrosion-sensitive surfaces of stainless steels by the processors, available on researchgate.net
[6] Patent specification DE 10 2010 037 775 B4: Condition for the detection of corrosion-sensitive metal surfaces and method for the detection of corrosion-sensitive metal surfaces, patent granted on 8.5.2014
[7] Rosemann, P.; Kauss, N.; Heyn, A.: KorroPad-Prüfung - Anwendungen aus Industrie und Forschung, 3-Länder-Korrosionstagung - Korrosion ist kein Zufall - Neue Messmethoden, Analytik und Simulation, May 2019, Frankfurt a. Main, available on researchgate.net
[8] Rosemann, P.; Müller, T.; Babutzka, M.; Heyn, A.: Influence of microstructure and surface treatment on the corrosion resistance of martensitic stainless steels 1.4116, 1.4034, and 1.4021, Materials and Corrosion, 66, (2015), 45-53, https://doi.org/10.1002/maco.201307276
[9] Reinemann, S.; Babutzka, M.; Rosemann, P.; Lehmann, J.; Burkert, A.: Influence of grinding parameters on the corrosion behavior of austenitic stainless steel, Materials and Corrosion, 70,( 20199, 1776-1787, https://doi.org/10.1002/maco.201910874
[10] Kauss, N.; Heyn, A.; Halle, T.; Rosemann, P.: Detection of sensitization on aged lean duplex stainless steel with different electrochemical methods, Electrochimica Acta 317 (2019) 17-24, https://doi.org/10.1016/j.electacta.2019.05.081
[11] Newton, C.J.; Sykes, J.M.: A galvanostatic pulse technique for investigation of steel corrosion in concrete, Corrosion Science, 28(1988) No. 11, 1051-1074, https://doi.org/10.1016/0010-938X(88)90101-1
[12] Spark, A.J.; Cole, I.; Law, D.; Ward, L.: The effect of peptide based nutrients on the corrosion of carbon steel in an agar based system, Corrosion Science 110, (2016), 174-181, https://doi.org/10.1021/acs.est.7b00437
[13] Spark, A. J.; Cole, I.; Law, D.; Marney, D. and Ward, L.: Investigation of agar as a soil analogue for corrosion studies. Materials and Corrosion 67 (2016), 7-12, https://doi.org/10.1002/maco.201508312
[14] Spark, A.J.; Law, D.W.; Ward, L.P.; Cole, I.S.; Best, A.S.: Effect of Pseudomonas fluorescens on Buried Steel Pipeline Corrosion, Environmental Science & Technology, 51(2017)15, 8501-8509, https://doi.org/10.1021/acs.est.7b00437
[15] Vanbrabant, J.; van de Velde, N.: Industrial application of an electrochemical corrosion test using a gel matrix as simulation for atmospheric and solid media, Proceedings: European General Galvanizers Association Intergalva Berlin, Vol. 19, June 7th, 2000, 29/1 to 29/13
[16] Shao, X.M.; Feldman, J.L.: Micro-agar salt bridge in patch-clamp electrode holder stabilizes electrode potentials, Journal of Neuroscience Methods 159, (20079, 108-115, https://doi.org/10.1016/j.jneumeth.2006.07.001
[17] Monrrabal, G.; Guzmán, S.; Hamilton, I.E.; Bautista, A.F.; Velasco, F.: Design of gel electrolytes for electrochemical studies on metal surfaces with complex geometry, Electrochimica Acta, Volume 220, December 2016, 20-28, http://dx.doi.org/10.1016/j.electacta.2016.10.081
[18] Monrrabal, G.; Ramírez-Barat, B.; Bautista, A.; Velasco, F.; Cano, E.: Non-Destructive Electrochemical Testing for Stainless-Steel Components with Complex Geometry Using Innovative Gel Electrolytes. Metals,8, (2018), 500, https://doi.org/10.3390/met8070500
[19] Monrrabal, G.; Huet, F.; Bautista, A.: Electrochemical noise measurements on stainless steel using a gelled electrolyte, Corrosion Science, Volume 148, March 2019, Pages 48-56, https://doi.org/10.1016/j.corsci.2018.12.004
[20] Monrrabal, G.; Bautista, A.; Valesco F.: Use of Innovative Gel Electrolytes for Electrochemical Corrosion Measurements on Carbon and Galvanized Steel Surfaces, CORROSION, Vol. 75, No. 12, December 2019, 1502-1512, https://doi.org/10.5006/3309
[21] Cano, E.; Crespo, A.; Lafuente, D.; Ramirez Barat, B.: A novel gel polymer electrolyte cell for in-situ application of corrosion electrochemical techniques, Electrochemistry Communications, 41 (2014), 16-19, https://doi.org/10.1016/j.elecom.2014.01.016
[22] Di Turo, F.; De Vito, C.; Coletti, F.; Mazzei, F.; Antiochia, R.; Favero, G.: A multi-analytical approach for the validation of a jellified electrolyte: Application to the study of ancient bronze patina, Microchemical Journal, Vol. 134, 2017, 154-163, https://doi.org/10.1016/j.microc.2017.05.015
[23] Babutzka, M.; Burkert, A.; Heyn, A.: Korrosionsuntersuchungen mit gelartigen Elektrolyten zur Beschreibung der Korrosionsschutzwirkung von Zinküberzügen, 16th Summer Course on Materials and Joining: Magdeburg, September 8 and 9, 2017, 119-128, http://dx.doi.org/10.25673/5002
[24] Babutzka, M.; Heyn, A.: Dynamic tafel factor adaption for the evaluation of instantaneous corrosion rates on zinc by using gel-type electrolytes, IOP Conf. Ser.: Mater. Sci. Eng. 181, (2017), 012021, https://doi.org/10.1088/1757-899X/181/1/012021
[25] Labille, J.; Fatin-Rouge, N.; Buffle, J.: Local and Average Diffusion of Nanosolutes in Agarose Gel: The Effect of the Gel/Solution Interface Structure, Langmuir, 23, (2007), 2083-2090, https://doi.org/10.1021/la0611155
[26] Vaucher, S.; Li, M.; Mann, S.: Synthesis of Prussian Blue Nanoparticles and Nanocrystal Superlattices in Reverse Microemulsions, Angew. Chem. Int. ed, 39, 1793-1796 http://www.doi.org/10.1002/(SICI)1521-3773(20000515)39:10<1793::AID-ANIE1793>3.0.CO;2-Y
[27] Ogston, A.G.; Preston, B.N.; Wells, J.D.: On the transport of compact particles through solutions of chain polymers, Proc. R. Soc. London, A. 1973333, (19739, 297-316, https://doi.org/10.1098/rspa.1973.0064
[28] Somma, M.; Querci M.: The Analysis of Food Samples for the Presence of Genetically Modified Organisms, Session 5: Agarose Gel Electrophoresis, 62, https://doi.org/10.2760/5277
[29] Draft standard for a test method for the determination of surface resistances on zinc coatings using gel-like electrolytes - GELELEK, research project in the BMWi research initiative WIPANO, Project Management Jülich, Berlin
[30] Killik, A.: Influencing factors on the corrosion of differently galvanized steel test specimens in short-term corrosion tests and in the field, dissertation, Otto von Guericke University Magdeburg, 2016
[31] J.R. Scully: Polarization Resistance Method for Determination of Instantaneous Corrosion Rates, Corrosion Vol. 56, (2000) No. 2, 199-218, NACE International, https://doi.org/10.5006/1.3280536
[32] ASTM G3-14: Standard Practice for Conventions Applicable to Electrochemical Measurements in Corrosion Testing, Reapproved 2019
[33] DIN EN ISO 9223:2012: Corrosion of metals and alloys - Corrosivity of atmospheres - Classification, determination and estimation
[34] Heyn A.: Evaluation of the corrosivity of atmospheres based on weather data, 16th Summer Course Materials and Joining: Magdeburg, September 8 and 9, 2017, 129-138, http://dx.doi.org/10.25673/5002


