– Part 2 – Pourbaix Diagrams and Types of Corrosion
Corrosion and passivation are critical concepts for reactive metals like iron, magnesium, and aluminium, which are unstable in aqueous environments at different pH levels and potentials. Depending on the environment, these metals may either corrode or become passivated against corrosion. The Pourbaix or Potential-pH diagram is an essential tool for understanding these processes, as it graphically depicts the thermodynamic stability zones of various ionic species in a metal-water electrolyte system. Corrosion manifests in various forms, and there are many classifications based on the causes of metal deterioration and their visual characteristics. This article describes Pourbaix diagrams of important metals and classifications of different forms of corrosion.
The Pourbaix diagram is constructed by plotting the equilibrium potential (E) between a metal and its various oxidised species as a function of pH [1]. In 1945, Marcel Pourbaix (Fig. 1), a Russian-born Belgian chemist (1904-1998), proposed the unique potential-pH diagrams for elements in water in his work "Atlas of Electrochemical Equilibria in Aqueous Solutions,“ which is now commonly referred to as the "Pourbaix diagrams“. These diagrams are also called "equilibrium diagrams“ because they apply to conditions where the metal is in equilibrium with its environment. Pourbaix diagrams are available for over 70 different metals [2]. This diagram utilizes thermodynamic considerations to define potentials corresponding to the equilibrium states of all possible reactions between a given element, its ions, and its solid and gaseous compounds in aqueous solutions as a function of pH.
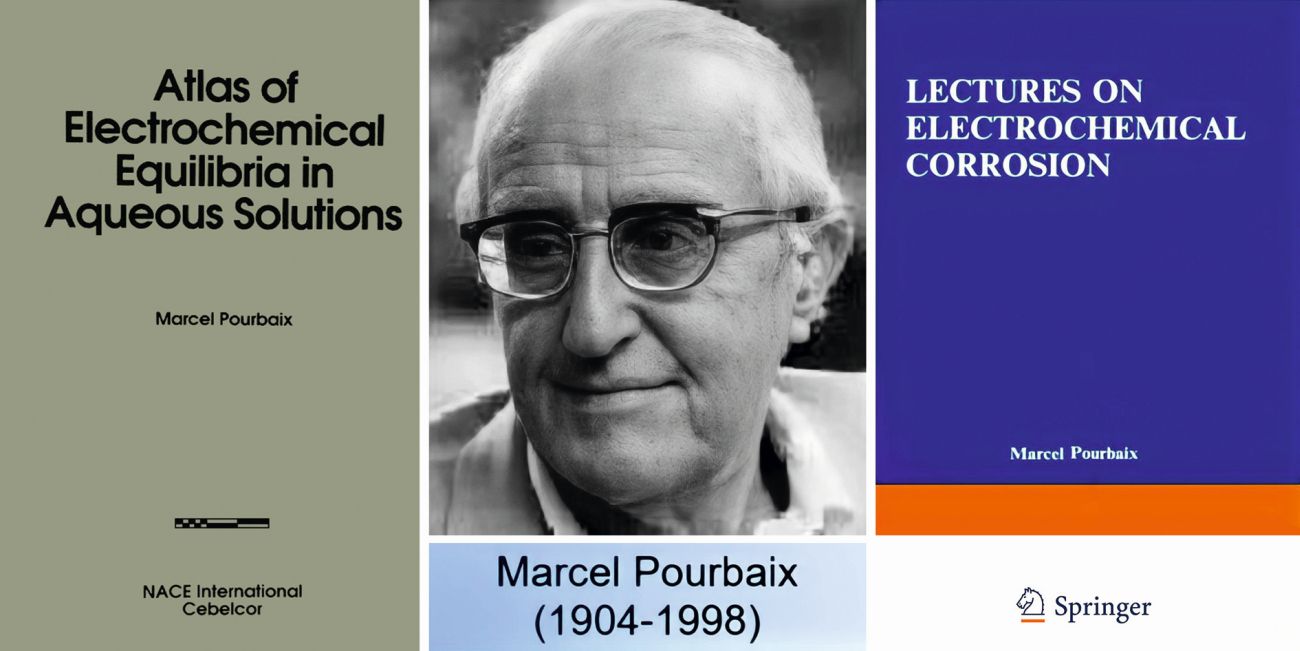 Fig. 1: Marcel Pourbaix proposed the unique potential-pH diagrams, now known as Pourbaix diagrams, in 1945
The half-cell reactions, which describe the dissolution of a metal as M = Mz+ + z e−, are influenced by several factors, including the potential (E), pH, and the concentration of the oxidized species (Mz+). A Pourbaix diagram is akin to an alloy's phase diagram, plotting equilibrium lines between different phases as temperature and composition change.
The vertical axis is marked as EH (or just E), representing the voltage potential relative to the standard hydrogen electrode (SHE), as determined by the Nernst equation. The H denotes hydrogen, though other standards can be applied, and these measurements are specific to room temperature conditions. In addition to potential and pH, equilibrium concentrations also depend on factors such as temperature, pressure, and concentration. Since the Nernst equation is based solely on thermodynamics, the Pourbaix diagram can identify the thermodynamically stable species at a specific E and pH. Pourbaix diagrams are instrumental in assessing the corrosion behaviour of metals in aqueous solutions, indicating the direction of electrochemical processes and the metal's equilibrium state at a given electrode potential and pH value.
Oxidizing conditions are depicted at the top of the diagram, indicated by a high positive electrode potential. Conversely, reducing conditions are shown at the bottom, marked by a high negative electrode potential.
Acidic solutions are represented on the left side of the diagram, where the pH is lower than 7, while alkaline solutions are on the right side, with a pH higher than 7.
The diagram's lines, which demarcate different zones of equilibrium states, are derived using the Nernst equation:
E = E° - (0.059/n) x log10(Cion)
where E° represents the standard electrode potential in volts; n is the number of electrons transferred; and Cion is the molar activity or concentration of ions.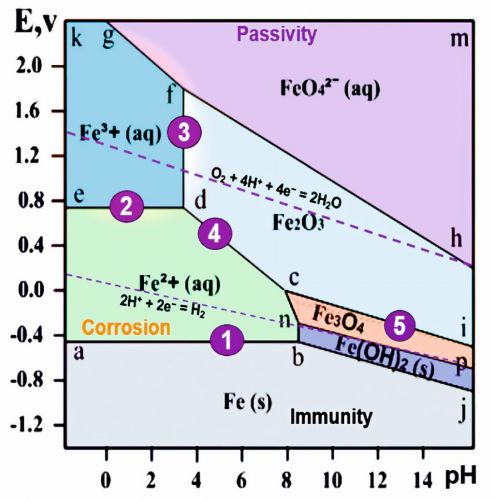 Fig. 2: Simplified Pourbaix diagram of iron-water system
An example of a Pourbaix diagram for iron-water system is illustrated in Figure 2 [3, 4]. Areas marked in the Pourbaix diagram indicate regions where a single species, such as Fe2+(aq), Fe3O4(s), etc., is stable. The more stable species tend to occupy larger areas. Lines on the diagram denote locations where two species are in equilibrium. Horizontal lines correspond to the pure redox reactions, which are independent of pH. Vertical lines are pure acid-base reactions depend on pH and are independent of potential. Diagonal lines correspond to the redox reactions, which are dependent on pH. These lines have a slope of -0.0592 V/pH x H+⁄e−.
- a-b: Fe2+(aq) + 2 e− → Fe(s) (pure redox reaction; slope = 0, i.e., independent of pH). The equilibrium occurs at the electrode potential value -0.44V, which is equal to the standard electrode potential of iron
- e-d: Fe3+(aq) + e− → Fe2+(aq) (pure redox reaction; slope = 0, i.e., independent of pH)
- d-f: 2 Fe3+(aq) + 3 H2O(l) → Fe2O3(s) + 6 H+ (slope= infinite, i.e., independent of potential, no redox, pure acid-base)
- c-d: 2 Fe2+(aq) + 3 H2O(l) → Fe2O3(s) + 6 H+ +2 e− (slope = -59.2 x 6/2 = -178 mV/pH)
- b-j: Fe(s) + 2 H2O(aq) = Fe(OH)2(s) + 2 H+ + 2 e− (slope = -59.2 x 2/2 = -59.2 mV/pH)
(4) and (5) are pH-dependent redox (proton-coupled electron transfer). The diagram outlines the following equilibrium state zones:
Below the line a-b-j: Solid iron (immunity zone). In this zone, electrochemical reactions favour the reduction of iron ions, preventing corrosion.
a-b-n-c-d-e: Aqueous solution of Fe2+ ions (corrosion zone). Metallic iron undergoes oxidation (corrode) in this zone.
e-d-f-g-k: Aqueous solution of Fe3+ ions (corrosion zone). In this zone, metallic iron oxidizes.
h-f-g-m: Aqueous solution of FeO42− ions (corrosion zone).
c-d-f-h-i: Solid ferric oxide Fe2O3 (passivation zone). Iron oxidizes in this zone, but the resulting oxide film inhibits further oxidation, leading to passivation.
n-c-i-p: Solid oxide Fe3O4 (Fe2O3*FeO) (passivation zone). Here also, the oxide film leads to passivation.
b-n-p-j: Solid ferrous hydroxide Fe(OH)2 / FeO*nH2O / green rust (passivation zone).
In a Pourbaix diagram, the redox lines for water are particularly significant for elements such as iron. Liquid water remains stable only within the region demarcated by the dotted lines. Below the H2 line, water becomes unstable relative to hydrogen gas, and above the O2 line, it is less stable than oxygen gas. For reactive metals like iron, the stability region of the elemental form typically falls beneath the H2 line. This means that iron metal is not stable and tends to react upon exposure to water in this region [4]:
Fe(s) + 2 H+ → Fe2+(aq) + H2 (in acid)
Fe(s) + 2 H2O → Fe(OH)2(s) + H2 (in base)
Iron, and many other metals, are thermodynamically unstable in air-saturated water, where the solution's potential approaches the O2 line on the Pourbaix diagram. The spontaneous reactions that occur are as follows:
4 Fe(s) + 3 O2 + 12 H+ → 4 Fe3+ + 6 H2O (in acid)
4 Fe(s) + 3 O2 → 2 Fe2O3(s) (in base)
However, this oxidation process is significantly slower because the resulting oxide layer protects the surface, thus iron corrodes much more slowly in oxygen-rich solutions.
In the Pourbaix diagram, areas where iron and other active metals like Al are oxidized into soluble, ionic forms, such as Fe3+(aq) or Al3+(aq), show rapid corrosion. Yet, the formation of solid compounds like Fe2O3, and particularly Al2O3, eventually creates a protective layer that significantly slows down the corrosion process, a phenomenon known as passivation. This behaviour is summarized in the color-coded Pourbaix diagram (Fig. 3), where the red and green areas indicate conditions that lead to the formation of soluble and insoluble oxidation products of iron, respectively [4].
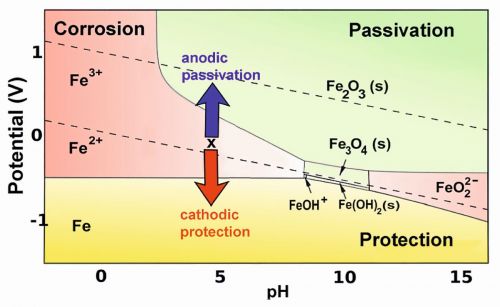 Fig. 3: Pourbaix diagram illustrating the anodic passivation and cathodic protection of ironIn the yellow section of the diagram iron can be protected by a secondary mechanism that biases its potential to fall below the metal's oxidation potential. This method of cathodic protection is commonly implemented by attaching a more reactive metal, such as magnesium or zinc, to the iron or steel structure (for instance, a ship's hull or an underground gas pipeline) that requires protection. The more reactive metal, which is higher than iron in the activity series and in contact with the solution, gradually corrodes and will eventually need replacement. In certain instances, a battery or DC power supply, where the anode oxidizes water to oxygen in the solution, is employed to apply a negative bias.
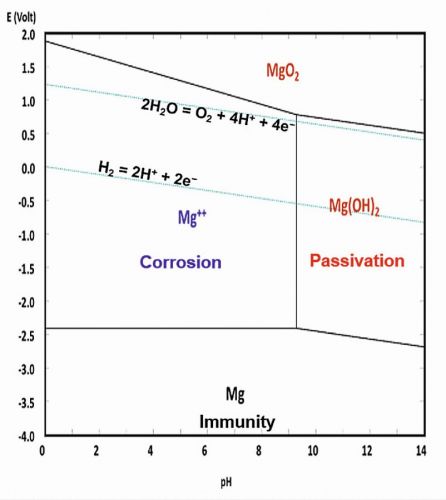
The Pourbaix diagram for magnesium, which highlights its electrochemical behaviour in aqueous environments at 25 °C is depicted in Figure 4 [2, 5]. This diagram demonstrates that magnesium easily dissolves into Mg2+ ions in solutions with a pH lower than 10.
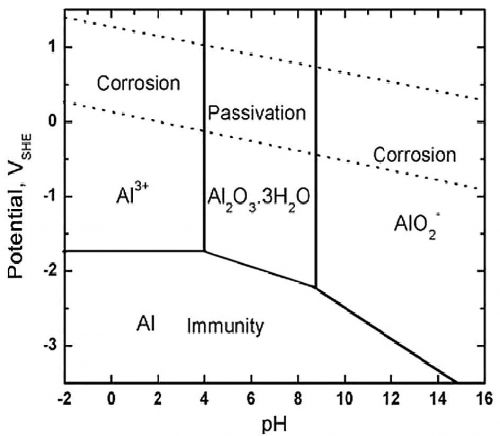
The Pourbaix diagram for aluminium delineating the zones of corrosion, immunity, and passivation at 25 °C is illustrated in Figure 5 [6]. In corrosive environments with a pH range of 3.6-8.9, the protective oxide layer is compromised, resulting in continuous metal dissolution.
Limitations of Pourbaix Diagrams
Pourbaix diagrams are subject to certain limitations, such as [3, 7]:
- Pourbaix diagrams are specific to reactions involving pure metals and pure water, and do not extend to alloys and impurities. The thermodynamic conditions governing the corrosion of alloys differ from those represented in these diagrams.
- The assumption of equilibrium conditions in Pourbaix diagrams may not always hold true in practice. Pourbaix diagrams are typically presented at room temperature, 1 bar atmospheric pressure, and ion concentrations of 10–6 M. Changing any of these conditions will yield a different diagram.
- These diagrams do not provide information on the kinetic parameters of the corrosion reactions.
- Pourbaix diagrams do not account for the non-ideal behaviour of aqueous solutions.
- The thermodynamic data used to construct these diagrams are not precise enough.
- Pourbaix diagrams do not offer information on actual corrosion rates and do not specify whether passivation is protective.
- Pourbaix diagrams do not take into account the environmental conditions, such as presence of chloride or sulphate ions that can act as catalysts for corrosion.
Types of Corrosion
Corrosion can appear in diverse forms, and numerous classifications exist based on the causes of metal deterioration and their visual characteristics [8]. Fontana and Greene [9, 10] classified metallic corrosion into eight distinct types based on its manifestation:
- uniform, or general attack,
- galvanic, or two-metal corrosion,
- crevice corrosion,
- pitting,
- intergranular corrosion,
- selective leaching, or parting,
- erosion corrosion, and
- stress corrosion.
Dillon [11], and Roberge [1] have categorized corrosion into three primary groups based on the ease of their identification:
Group I: Corrosion readily identifiable through visual inspection, which includes uniform corrosion, localized corrosion (pitting, crevice), and galvanic corrosion.
Group II: Corrosion detection that may require supplementary means of examination, comprising corrosion due to velocity effects (erosion, cavitation, and fretting corrosion), intergranular corrosion, and de-alloying.
Group III: This type of corrosion is not conclusively identifiable through visual inspection alone in its early stages. Supplementary techniques, such as optical or electron microscopy, are typically required for verification. However, in later stages, the damage may become visible to the naked eye. This category includes various cracking phenomena such as corrosion fatigue, stress corrosion cracking, exfoliation, high-temperature corrosion, hydrogen grooving and microbial effects.
Figure 6 illustrates the main forms of corrosion based on ease of recognition, along with their corresponding group [1]. It is important to note that there may be a noticeable overlap between groups II and III. The classification of corrosion has expanded beyond Fontana's original eight fundamental types and Dillon and Roberge's categorization.
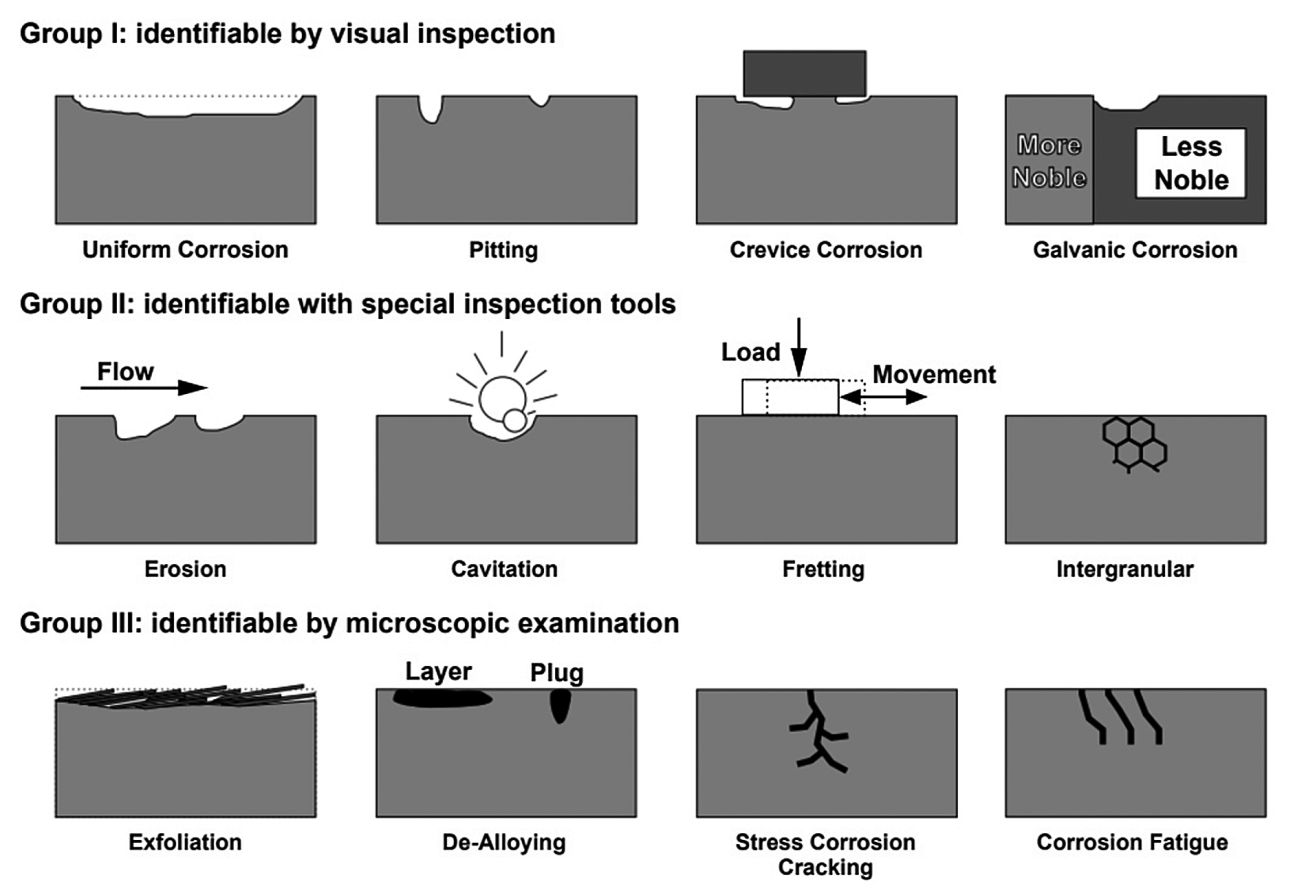 Fig. 6: Main forms of corrosion based on ease of recognition
Passivation plays a crucial role in reducing corrosion damage, yet even premium alloys may corrode if their passivating film formation is obstructed. Selection of right grade material for a given environment is vital for durability. When the passive layer is compromised due to chemical or mechanical factors, it can lead to an accelerated localized corrosion attack, which may manifest as crevice corrosion, pitting, stress corrosion cracking, or intergranular corrosion [12, 13]. Localized corrosion becomes more pronounced in the presence of heterogeneous conditions. It is characterized by fixed anodic sites on a surface where the oxidation reaction prevails, surrounded by a cathodic area where reduction occurs. This type of corrosion is particularly insidious and difficult to predict and control, potentially causing unforeseen and catastrophic damage [14]. The different forms of corrosion will be explored in detail in the subsequent parts of the article.
REFERENCES:
[1] P.R. Roberge: Handbook of Corrosion Engineering, McGraw-Hill LLC, First Edition, 1999, 1-1128; Second Edition, 2012, 1-994; Third Edition, 2019, 1-790. https://dl.icdst.org/pdfs/files/441d337b7410198db6d96e61a6716302.pdf
[2] M. Pourbaix: Atlas of Electrochemical Equilibria in Aqueous Solution, 2nd Edition, NACE International Cebelcor, Houston, Texas, USA, 1974, 1-644
[3] D. Kopeliovich: Pourbaix diagrams. https://www.substech.com/dokuwiki/doku.php?id=pourbaix_diagrams. Accessed on April 14, 2025
[4] Chapter 4.6: Pourbaix Diagrams. In Introduction to Inorganic Chemistry, Wikibook Penn State University, p. 4.6.1. https://chem.libretexts.org/@go/page/183315. Accessed on April 14, 2025
[5] B.A. Shaw: Corrosion Resistance of Magnesium Alloys. In: Corrosion: Fundamentals, Testing, and Protection, ASM Handbook, vol. 13A (2003) 1-6. https://users.encs.concordia.ca/~tmg/images/f/f3/Corrosion_Resistance_of_Magnesium_Alloys.pdf. Accessed on April 14, 2025
[6] M. Fousova; V. Valesova; D. Vojtech: Corrosion of 3D-Printed AlSi9Cu3Fe Alloy, Manuf. Technol., 19, no. 1 (2019) 29-36. https://www.journalmt.com/pdfs/mft/2019/01/06.pdf
[7] J. Barthel; R. Deiss: The limits of the Pourbaix diagram in the interpretation of the kinetics of corrosion and cathodic protection of underground pipelines, Mater. Corros., 72, no. 3 (2020) 434-445. doi: 10.1002/maco.202011977
[8] R. Landolfo; L. Cascini; F. Portioli: Modeling of metal structure corrosion damage: A state of the art report, Sustainability, 2, no. 7 (2010) 2163-2175; doi:10.3390/su2072163. https://www.mdpi.com/2071-1050/2/7/2163
[9] M.G. Fontana; N.D. Greene: Chapter 3: Eight Forms of Corrosion, Corrosion Engineering, McGraw-Hill Inc; First Edition, 1967, Third Edition, 1986, 1-556; The Association for Materials Protection and Performance (AMPP): Eight Forms of Corrosion by Fontana & Greene, 1967. https://www.ampp.org/technical-research/impact/corrosion-basics/group-1/eight-forms-of-corrosion; Corrosion Doctors: Eight forms of Corrosion by Fontana & Greene, 1967. https://corrosion-doctors.org/Corrosion-History/Eight.htm. Accessed on April 14, 2025
[10] M.G. Fontana; M.S. Mitra: The Eight Forms of Corrosion & the Corrective Measures. In Symposium on Industrial Failure of Engineering Metals & Alloys, Feb. 5-7, 1953, NML, Jamshedpur. https://eprints.nmlindia.org/3414/1/137-148.PDF. Accessed on April 14, 2025
[11] C.P. Dilon: Forms of Corrosion: Recognition and Prevention, NACE international, Houston, Texas, USA, vol. 1 (1982) 1-116
[12] G.S. Frankel; N. Sridhar: Understanding localized corrosion, Materials Today, 11, no. 10 (2008) 38-44. doi: 10.1016/S1369-7021(08)70206-2
[13] A.H. Alamri: Localized corrosion and mitigation approach of steel materials used in oil and gas pipelines – An overview, Eng. Fail. Anal., 116 (2020) 104735. doi: 10.1016/j.engfailanal.2020.104735
[14] F. Khoshnaw: Part I: General Aspects of Corrosion, Corrosion Control, and Corrosion Prevention. In Corrosion Atlas Case Studies, Corrosion Atlas Series, Elsevier, 2024, xxix-xlvi. doi: 10.1016/B978-0-443-13228-5.09993-1. https://www.sciencedirect.com/science/article/pii/B9780443132285099931

